*Disclosure: I don't hold or plan to trade any of the securities mentioned in this blog within the next 48 hours.
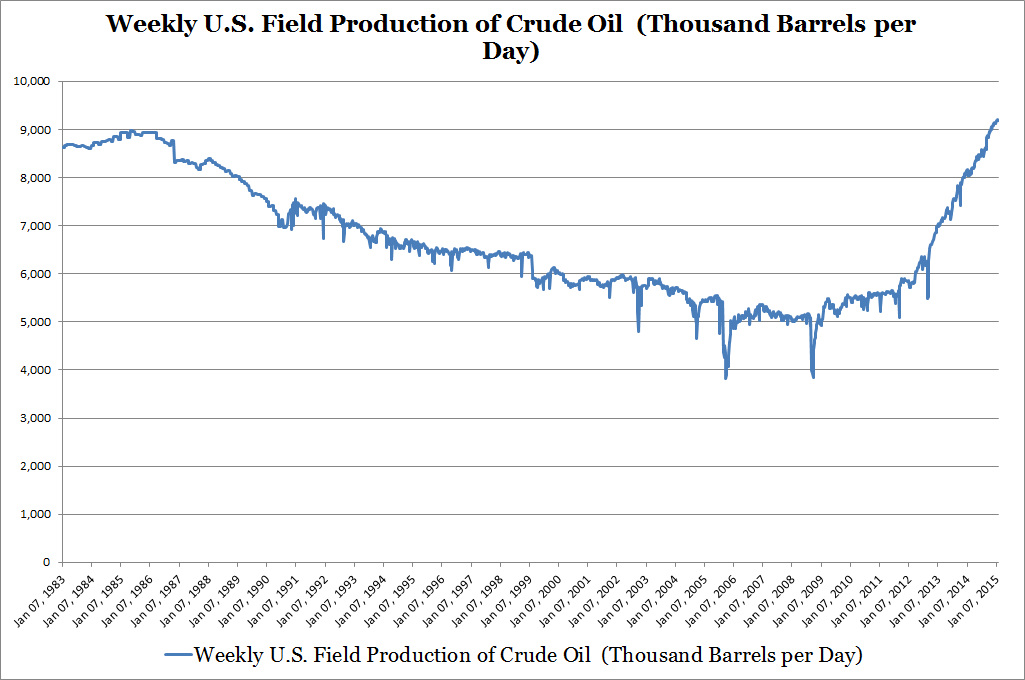
Source: US Energy Information Administration (EIA)
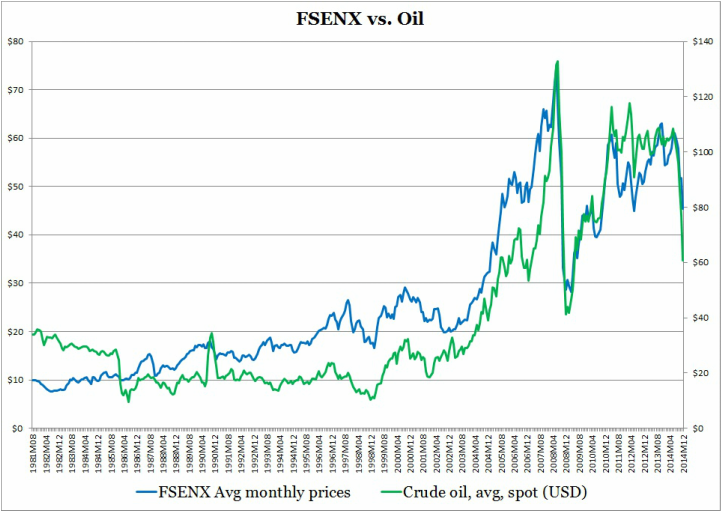
Record high US crude oil production! No wonder oil prices are dropping! This chart uses EIA's weekly US crude oil production data from January 7, 1983 to January 30, 2015. Look at the exponential production ramp up after the Great Recession and how we exceeded the previous production high in 1985.
I have integrated the latest production data into my Energy Industry Investment Model with results shown below.
I have integrated the latest production data into my Energy Industry Investment Model with results shown below.
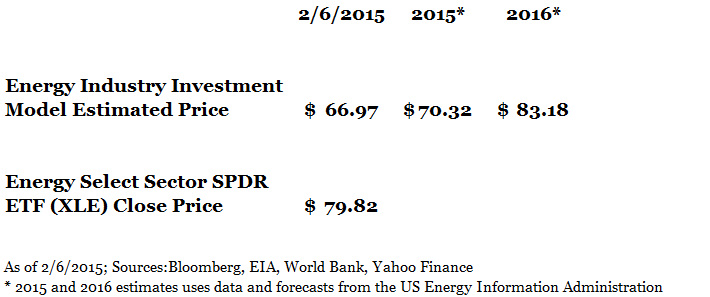
This week oil prices moved up to the $50/barrel range with continuing record oil production. EIA's US crude oil production for the week of January 30, 2015 is more than 9 million barrels a day and has been above the 9 million/day range since November 2014. The Energy Industry Investment Model predicts a price of $66.97, but XLE's closing price on 2/6/2015 is $79.82. I recommend investors consider not adding to their investments in XLE and conduct detailed due diligence on any energy stock investment decisions.
The EIA releases a new Short-Term Energy Outlook this week. Stay tuned for results next week as I integrate their new data and forecasts into my model. For more information about the Energy Industry Investment Model please visit my webpage on it. Link provided below.
The EIA releases a new Short-Term Energy Outlook this week. Stay tuned for results next week as I integrate their new data and forecasts into my model. For more information about the Energy Industry Investment Model please visit my webpage on it. Link provided below.


 RSS Feed