Energy Industry Investment Model
Adrian's Comments
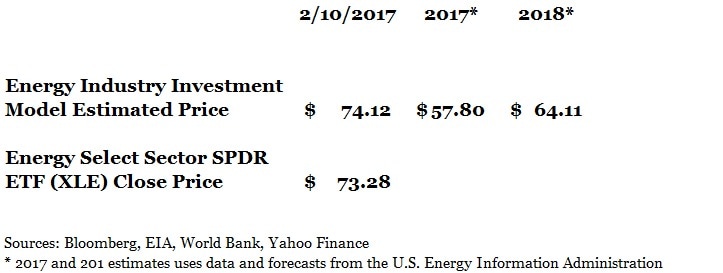
2/18/2017 - EIA's U.S. crude oil production for the week of February 3, 2017 increases to 8.98 million barrels. Crude oil production peaked at 9.6 million barrels/day on July 3, 2015. Crude oil production has been above the 9 million/day range since November 2014. 2017 and 2018 values estimates are updated based on the EIA's January forecast. Crude oil production is expected to be 8.98 million barrels/day in 2017 and 9.53 million barrels/day in 2018.
I recommend investors consider use a long term view of XLE and conduct detailed due diligence on any energy stock investment decisions as the short term ride can be quite bumpy. I'm in the process of developing a Stock Market Investment Model which will help estimate stock market performance for the Energy Industry Investment Model.
There are more detailed analysis and other energy industry write-ups in my blog entries.
Model Description
The energy industry includes companies that find, drill, and refine oil and natural gas. Examples include Exxon Mobil, Chevron Corporation, and Pioneer Natural Resources. A smaller part of the industry includes companies that provide energy equipment and services such as Schlumberger and Halliburton. This industry is cyclical in nature, rising during economic booms, and falling during economic busts.
The Energy Industry Investment Model estimates the price of XLE based on several fundamental and market factors:
The Energy Industry Investment Model estimates the price of XLE based on several fundamental and market factors:
- Oil Prices
- Oil Production
- Stock Market Performance
Model Strengths and Weaknesses
Strengths
Weaknesses
- High Regression Correlation, Statistically Significant Variables
- Relatively Simple Model
Weaknesses
- Significant misses in the late 1990s and early/mid 2000s
- Backtesting also reported significant misses
Future Updates/Enhancements
- Research and reduce significant miss periods seen in backtesting results. (see backtesting section below).
- Look into integrating natural gas, refinery production, and petroleum products data
- Develop a model to help forecast stock market performance.
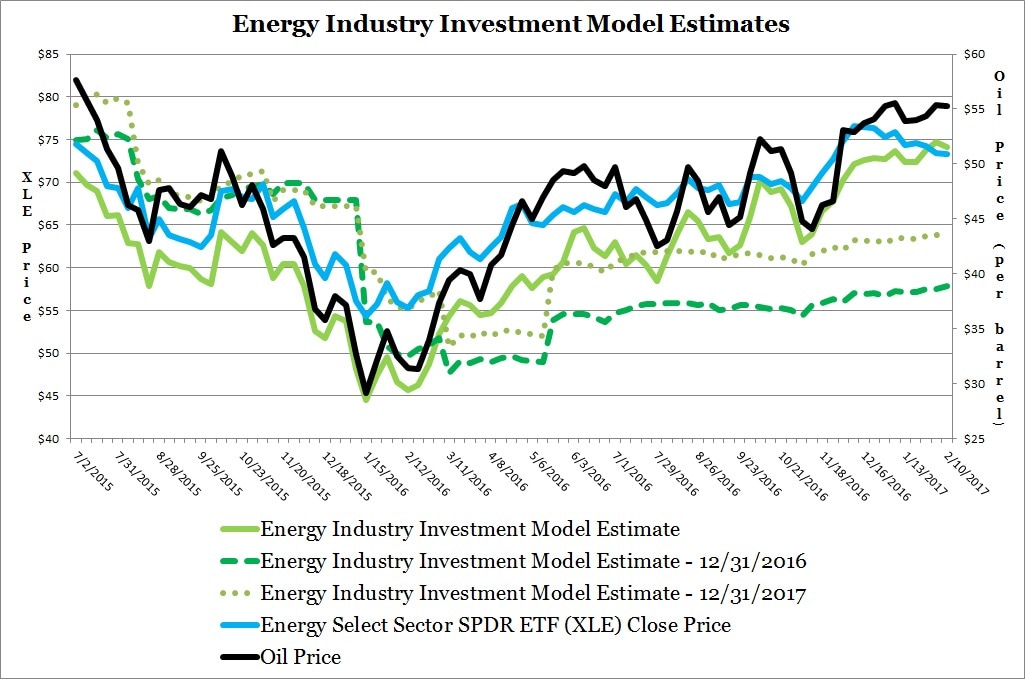
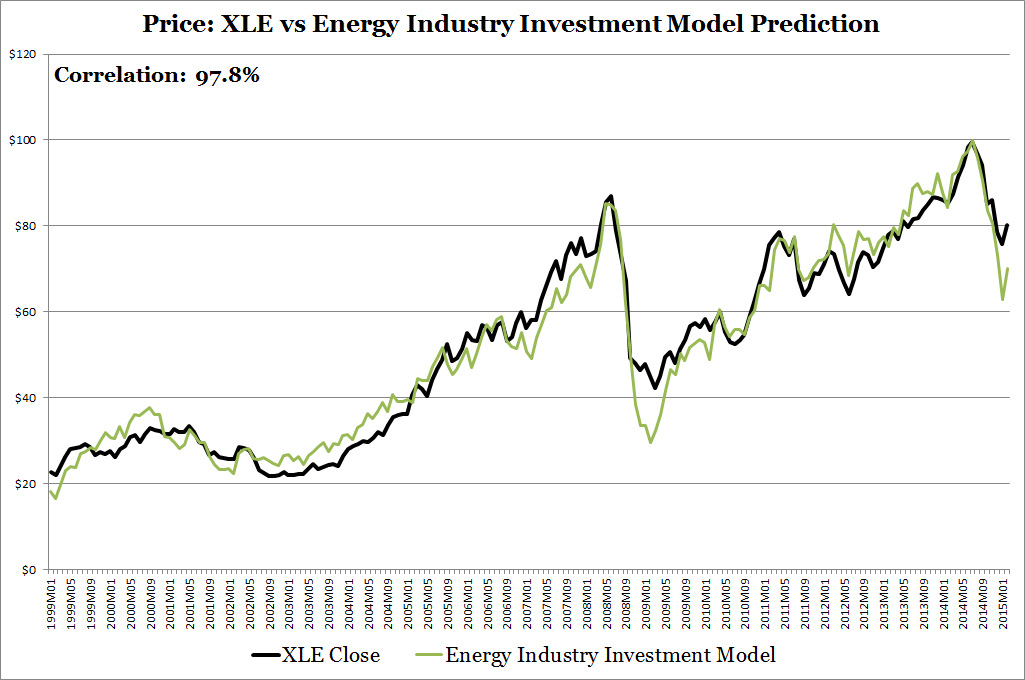
Historical Price of XLE versus Energy Industry Investment Model
Sources: EIA, World Bank, Yahoo Finance

Sources: EIA, World Bank, Yahoo Finance
Backtesting Results
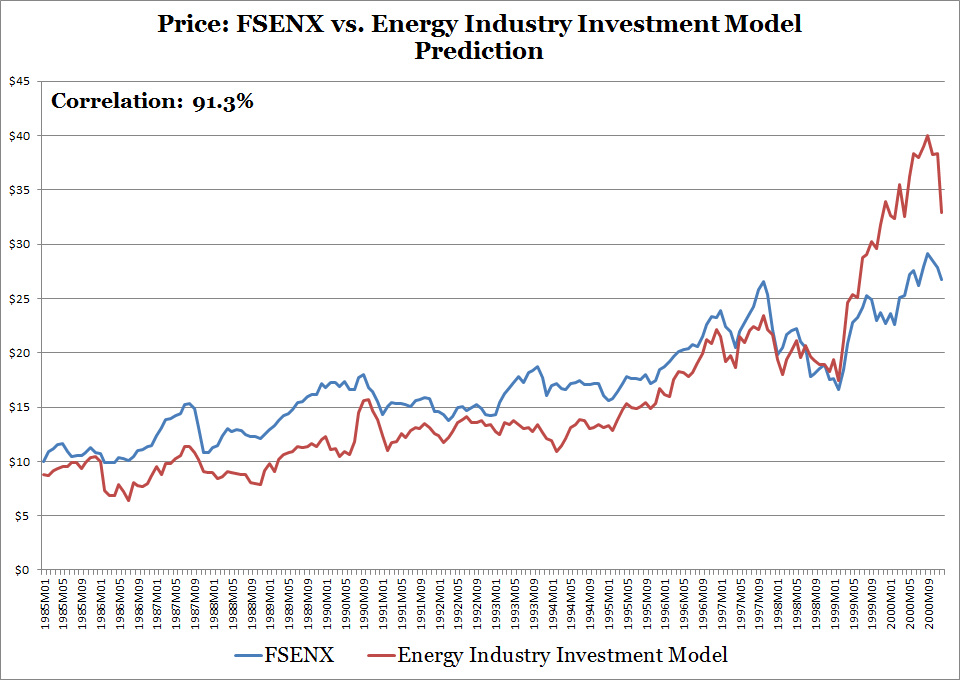
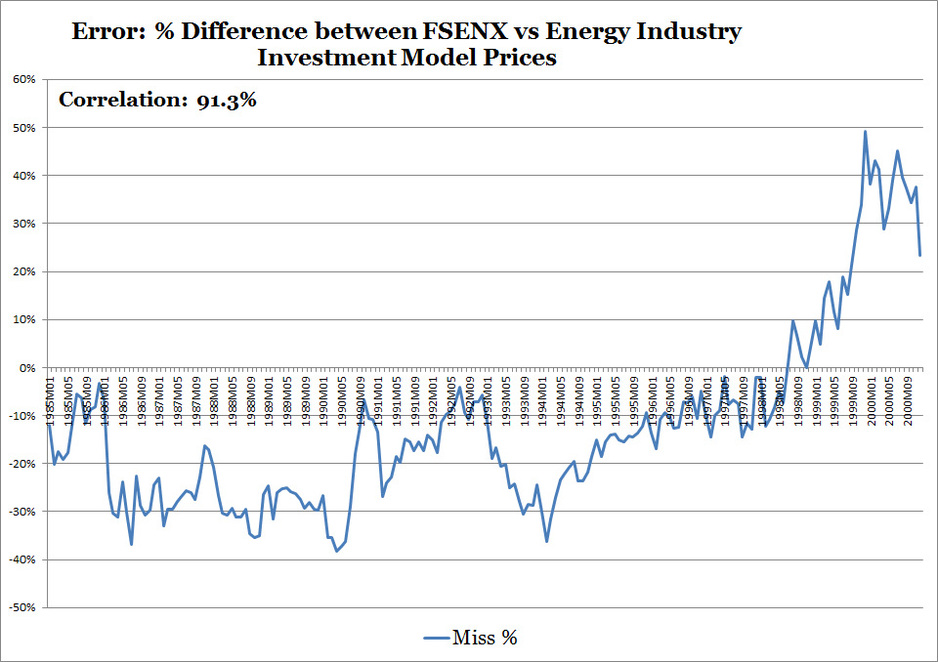
The Energy Industry Investment Model was tested against the Fidelity's Select Energy Portfolio (FSENX) from January 1985 through December 2000. The Fidelity portfolio was chosen because of its long operating history. To perform this test, historical fundamental data from January 1985 through December 2000 was used in the model to return FSENX's estimated historical prices.
Results
Analysis
Results
- High Correlation of 91.3%
- Period of significant misses
- % misses relatively constant for long periods
Analysis
- FSENX is an actively managed portfolio whereas XLE which is passively managed. This results in FSENX prices reflecting management successes and failures not necessarily index performance. Management fees in an actively managed mutual fund tend to be significantly more expensive than a passively traded portfolio. As of 1/16/2015 FSENX had a .80% annual expense, whereas XLE has a .16% annual expense. However, during the 1980s mutual fund fees were higher than today. I would estimate fees to be above 1% annually. The energy model is built using XLE's historical performance because it provides a better link between fundamental data and energy industry performance
- FSENX is a mutual fund whereas XLE is an exchange traded fund. Prices of the exchange traded fund are affected not only by the prices of the securities it holds but by the premium/discount the shares trade relative to the portfolio value. This premium/discount is small.
- There is a pattern to the energy model misses versus FSENX's price. Modeled results trail FSENX's prices from the 1985 to 1996 before rising above in 1999.
Sources: EIA, World Bank, Yahoo Finance
Sources: EIA, World Bank, Yahoo Finance