Sources: Yahoo Finance, US Census Bureau
Results excellent but with reservation
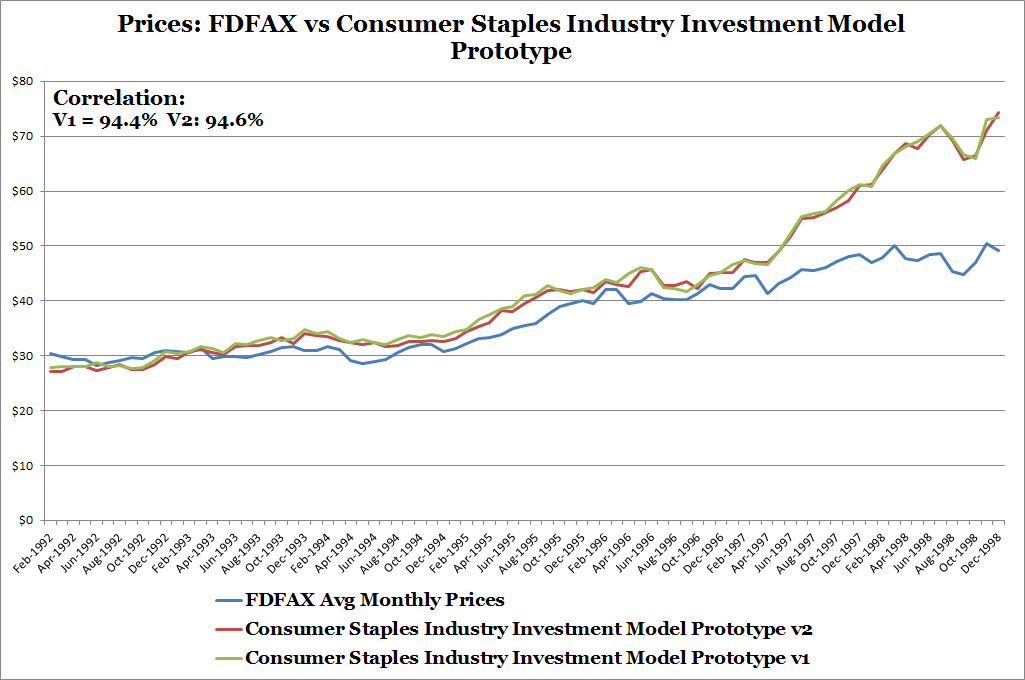
You might be wondering what's with the two versions of the prototype. After my previous post an enhancement was made to the way the model handled inventory. These lead to not only slightly better backtesting results but also the actual results versus the Consumer Staples Select Sector SPDR ETF (XLP).
What's not to like about the chart above?! For all purposes it shows the model being a great fit for FDFAX and statistical correlation very high. But the tail end of chart is where it fails. The model predicts ever increasing prices from the early stages of the dot com boom starting in the mid 1990s but FDFAX prices barely lift off.
After reviewing the wholesaler sales, wholesaler inventories, and stock market performance data, I determined that from 1992 - 1998 wholesaler inventory levels didn't explain FDFAX prices.
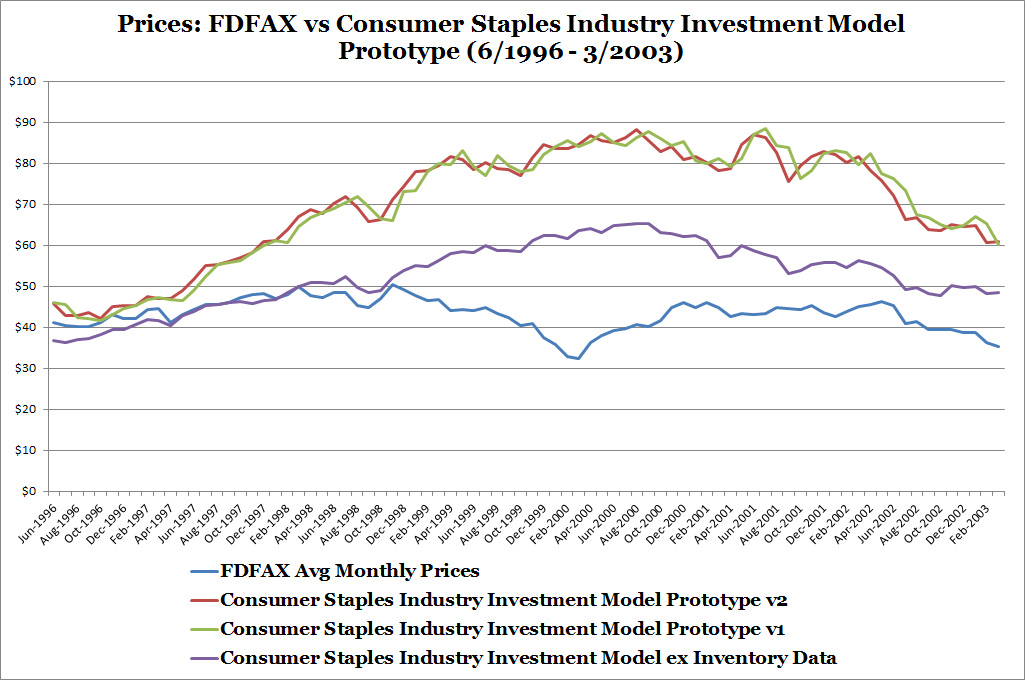
In the chart below I show model results for the dot com period and the subsequent recession (1996 to 2003) for V1, V2, and a new lite version of the model without inventory data. Although the light version of the model explains the first few years of the dot com boom, all three versions fail to explain FDFAX's drop and rise from the late 1990s to early 2000s.
You might be wondering what's with the two versions of the prototype. After my previous post an enhancement was made to the way the model handled inventory. These lead to not only slightly better backtesting results but also the actual results versus the Consumer Staples Select Sector SPDR ETF (XLP).
What's not to like about the chart above?! For all purposes it shows the model being a great fit for FDFAX and statistical correlation very high. But the tail end of chart is where it fails. The model predicts ever increasing prices from the early stages of the dot com boom starting in the mid 1990s but FDFAX prices barely lift off.
After reviewing the wholesaler sales, wholesaler inventories, and stock market performance data, I determined that from 1992 - 1998 wholesaler inventory levels didn't explain FDFAX prices.
In the chart below I show model results for the dot com period and the subsequent recession (1996 to 2003) for V1, V2, and a new lite version of the model without inventory data. Although the light version of the model explains the first few years of the dot com boom, all three versions fail to explain FDFAX's drop and rise from the late 1990s to early 2000s.
Source: Yahoo Finance, US Census Bureau
I had a few theories of what might have happened during this period.
The excitement! Which one do you think it is? The uncovered mystery could also help me unmask the Energy Industry Investment Model's backtesting runaway model results during the dot com boom era as well. Find out what I discover in my next blog post.
- Consumer staples companies have fallen out of favor versus other industry stocks during the time, most likely technology stocks.
- FDFAX's management made poor decisions in the late 1990s that detracted from investment performance but they recovered by the early 2000s.
- The Consumer Staples Industry Investment Model is incomplete is missing some factor.
- Something unexpected.
The excitement! Which one do you think it is? The uncovered mystery could also help me unmask the Energy Industry Investment Model's backtesting runaway model results during the dot com boom era as well. Find out what I discover in my next blog post.
 RSS Feed