I added a "Direct Access To Investment Models" page for those who want to download an Excel workbook with my investment models. There is a modest $1/month subscription fee. This took me a few days to plan, add a subscription membership system to the site, and to design/protect the Excel workbook.
I've been doing some research on the number of rigs versus oil production. I plan to present the data this weekend with my weekly energy industry update. I'm also thinking of building a model to estimate future stock market performance since that is a major industry investment model input.
You might be wondering how much web traffic I'm getting on this site and Seeking Alpha.
Website: 505 unique visitors, 1756 page views since website launch (1/17/2015)
Seeking Alpha: 12 followers gained, 7 blog entries shared, 7895 web and mobile page views
Below is my outstanding to-do-list:
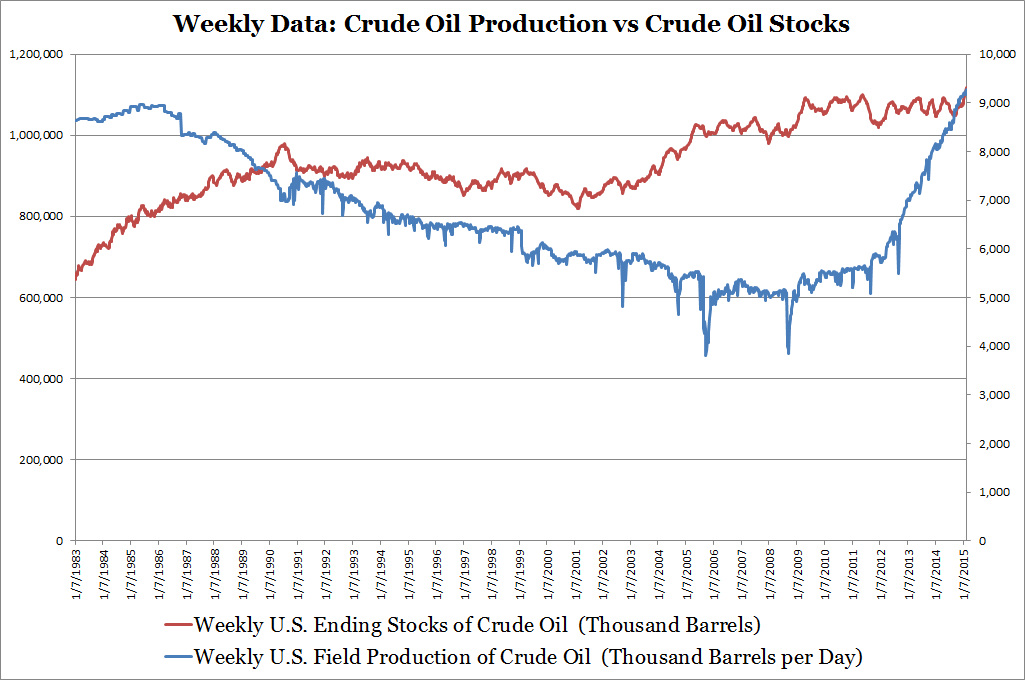
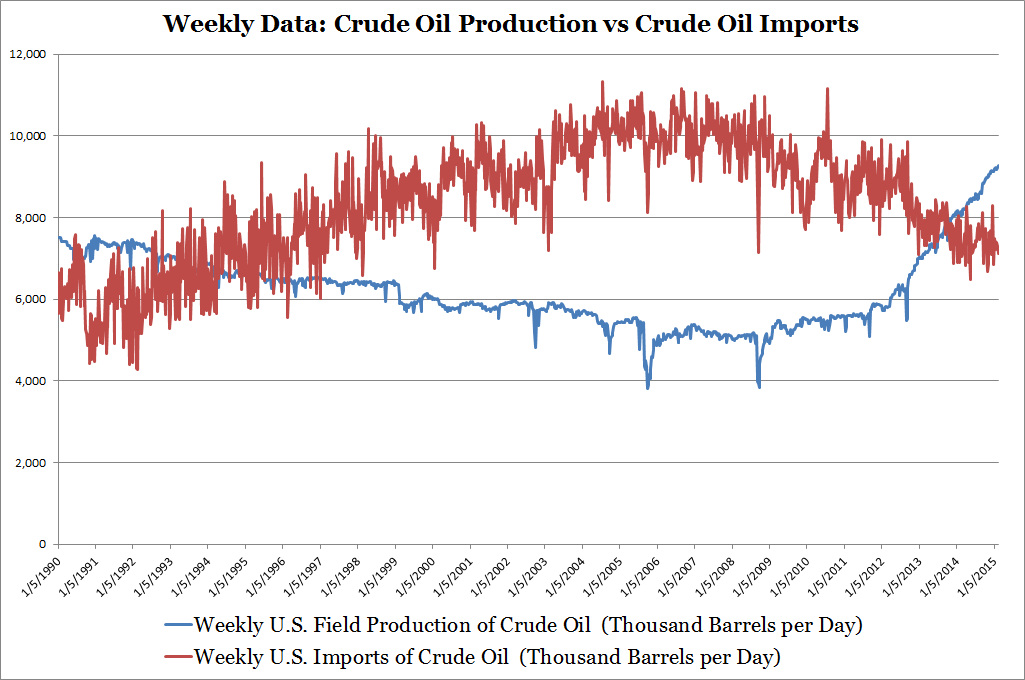
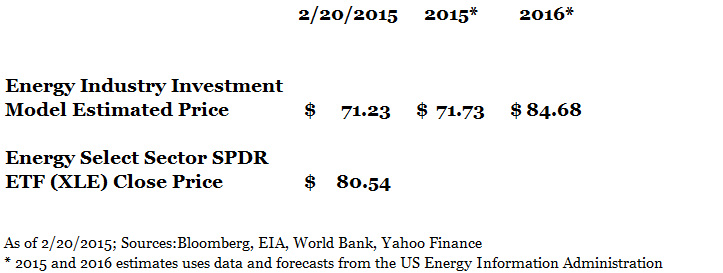
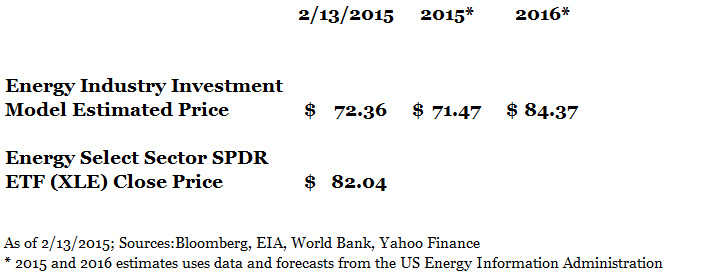
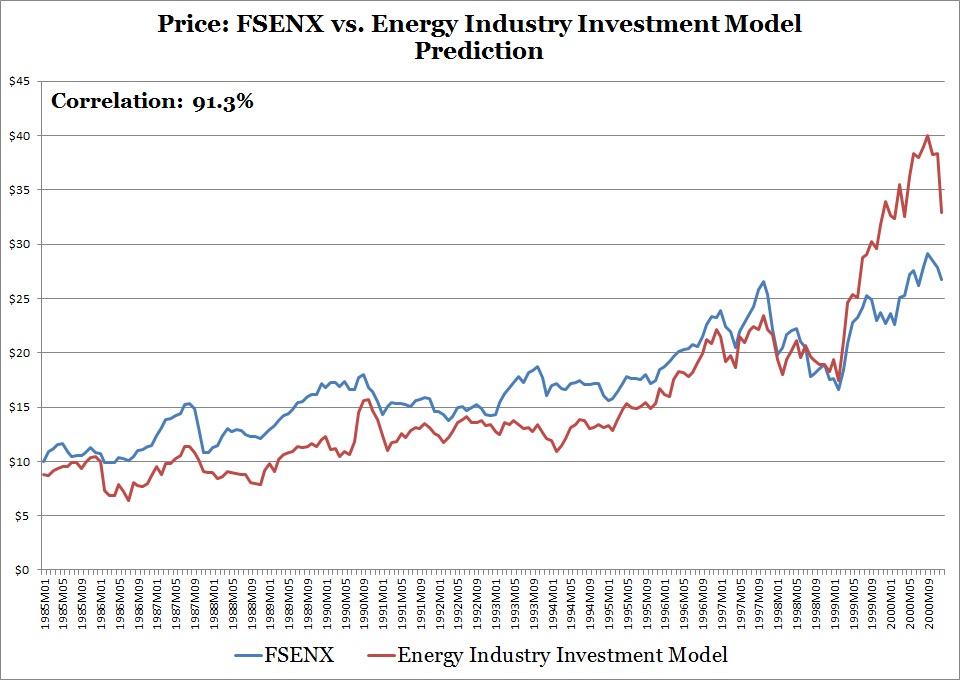
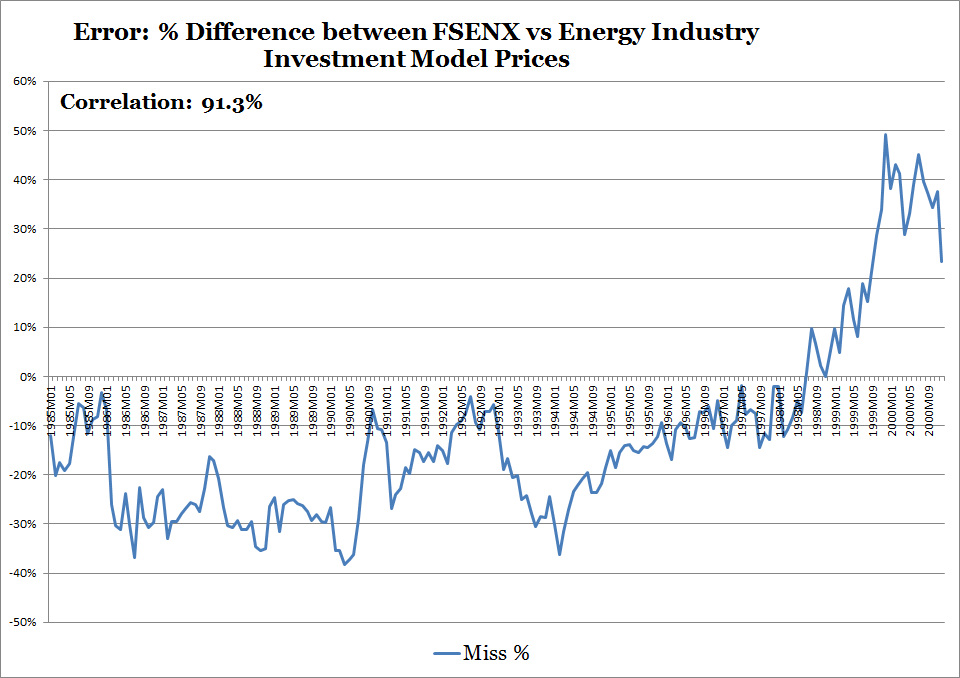
- Why the price estimate of my Energy Industry Investment Model is much lower than the Energy Select Sector SPDR ETF's (XLE) price. I'm looking for evidence to support my hypothesis that dividend investors are propping up energy industry stocks.
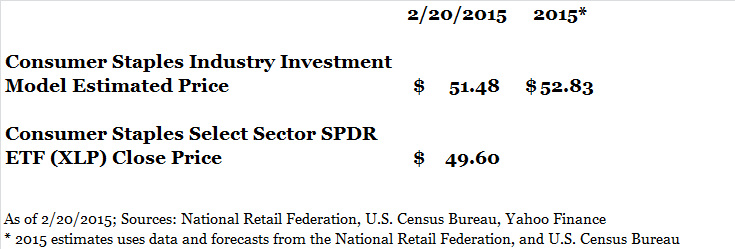
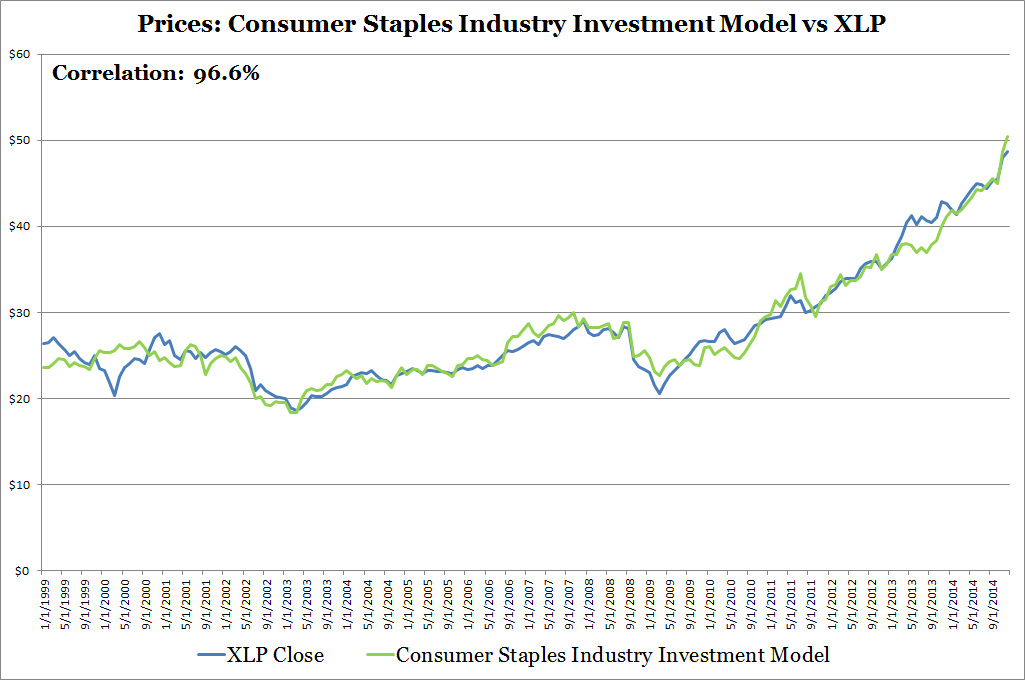
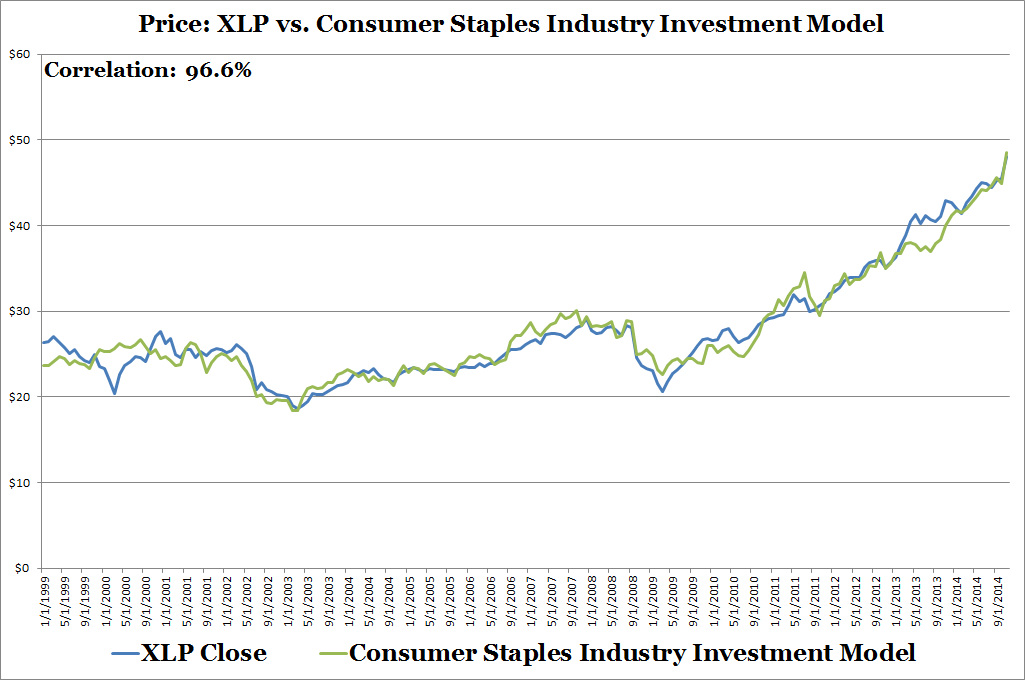
- The reason why merchant wholesaler inventory levels affects consumer staples industry stocks. I suspect two reasons: higher merchant wholesaler inventory levels equate to higher profit margins for consumer staples retailers or inventory levels is a result of future sales expectations.
- Look into building a stock market performance model.

 RSS Feed