I've wasted/spent/invested the entire day trying to backtest the two alpha versions of the Stock Market Investment Model for the S&P 500 that I created last week. Despite my efforts results have been mixed.
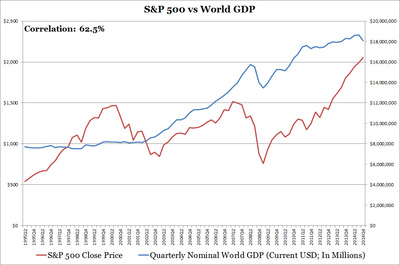
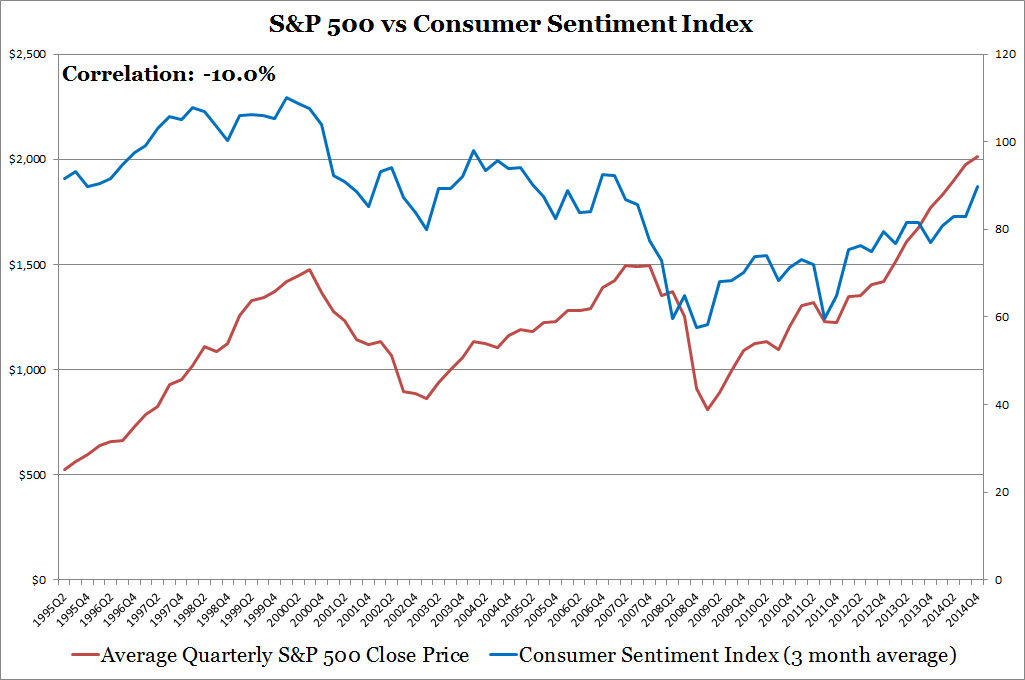
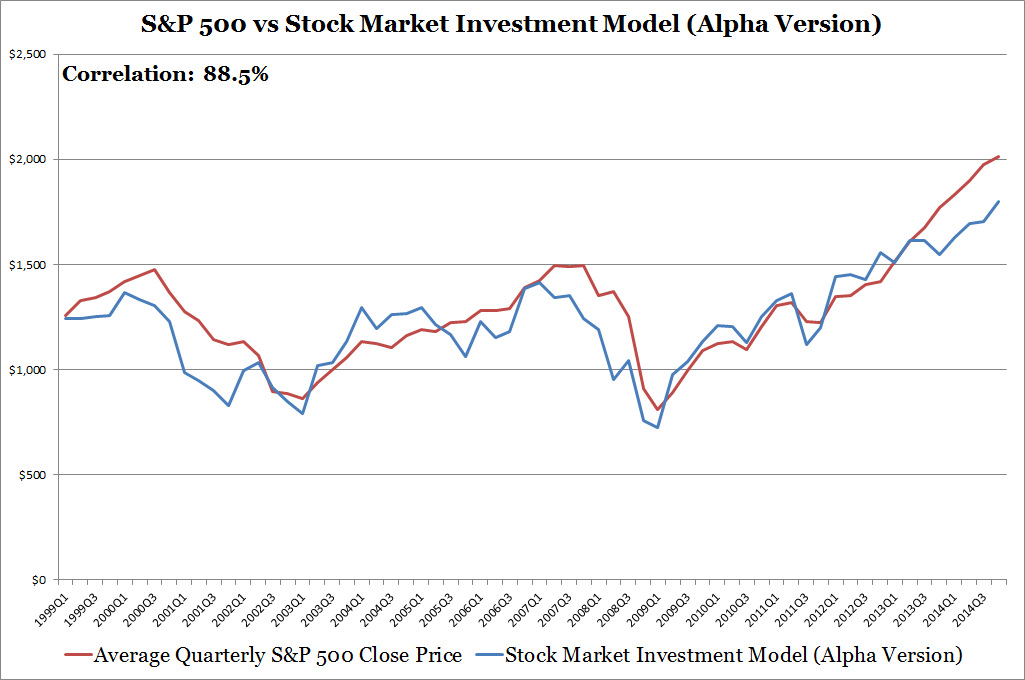
Just a recap, last week I found that the S&P 500 is highly correlated with GDP and consumer sentiment. This week I was able to create a third model. Listing the three models (I renamed the previous two to make it easier to identify):
Just a recap, last week I found that the S&P 500 is highly correlated with GDP and consumer sentiment. This week I was able to create a third model. Listing the three models (I renamed the previous two to make it easier to identify):
- Stock Market Investment Model (SMIM) World GDP - uses quarterly World GDP and Consumer Sentiment data.
- Stock Market Investment Model (SMIM) U.S. GDP - uses quarterly U.S. GDP and Consumer Sentiment data.
- Stock Market Investment Model (SMIM) U.S. GDP With Corporate Bond Yields - uses quarterly U.S. GDP, Consumer Sentiment, and Investment Grade Corporate Bond Yields.
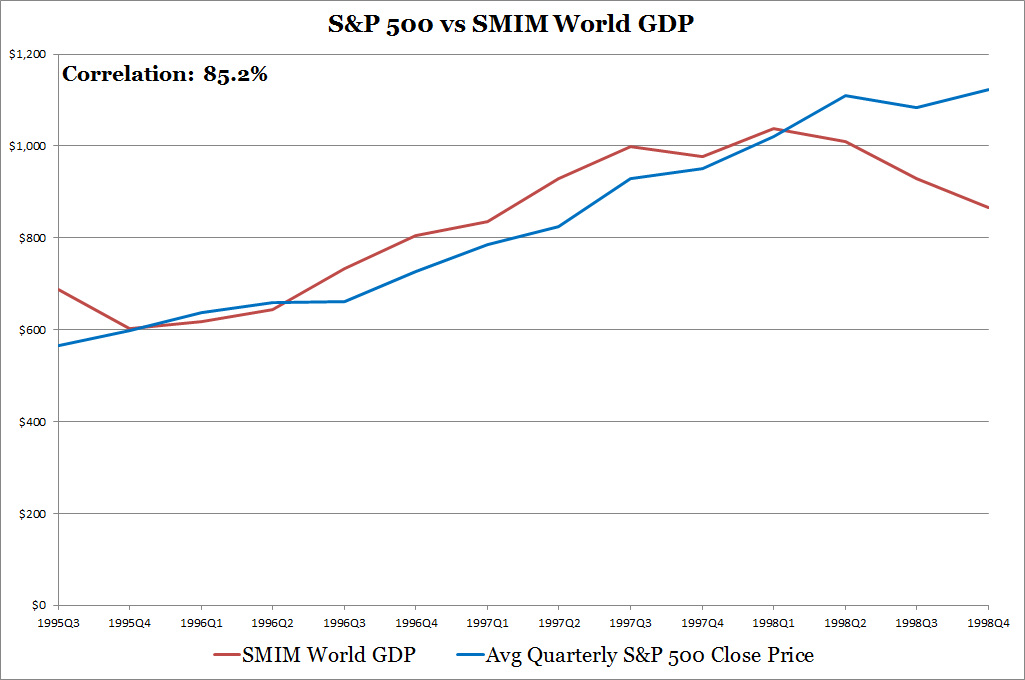
I will show backtesting results for each of the three models and then discuss next steps. Below, I show SMIM World GDP backtest results using data from 1995 to 1998. The 85.2% correlation is good but the backtest period is too short. I'm not able to conduct it using more dates because the World Bank only has data going back to 1995, however, I might be able to convert the International Monetary Fund's annual World GDP data for backtesting. Another issue is this model's inability to track the rise in S&P 500 in 1998 and the fall in 1995Q3. Both my website models also have trouble from the Dot Com era: 1995 to 2000. I'm hesitant to launch this model.
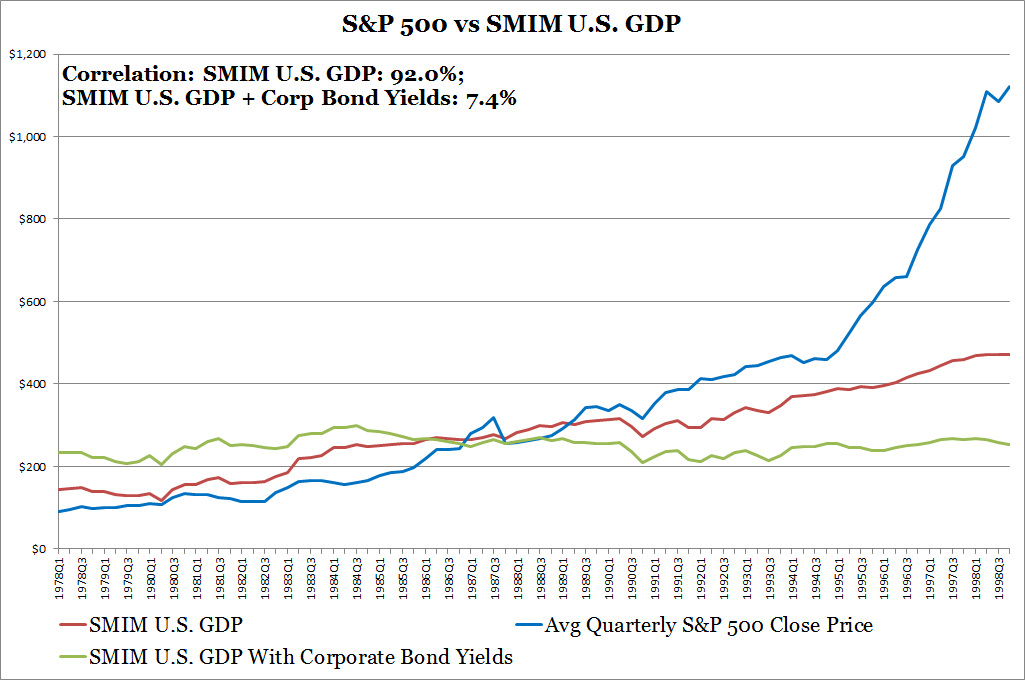
I put the next two models on the same chart below. Results are unexpected. Ignore the large Dot Com era misses after 1995 for now, I will address later on. The SMIM U.S. GDP With Corporate Bond Yield model which had the best correlation out of the three models from 1999 to 2014 collapses with an abysmal backtesting correlation. This illustrates the importance of a backtest.
As a side note, when I first developed the Energy Industry Investment Model my initial model collapsed as well during the backtest. The difference this time is that I used fewer four letter words. But anyways, coming back to the SMIM U.S. GDP With Corporate Bond Yield, I investigated and found that the model had a strong positive relationship between corporate bond rates and stock market performance, which isn't true historically nor logically. The Federal Reserve pumped out low interest interest rates in response to both the Dot Com Bust and Great Recession, but the model just saw lowering interest rates concurrently with declining stock market performance. Perhaps, if I can model corporate yields as a leading indicator to future stock market performance it will work.
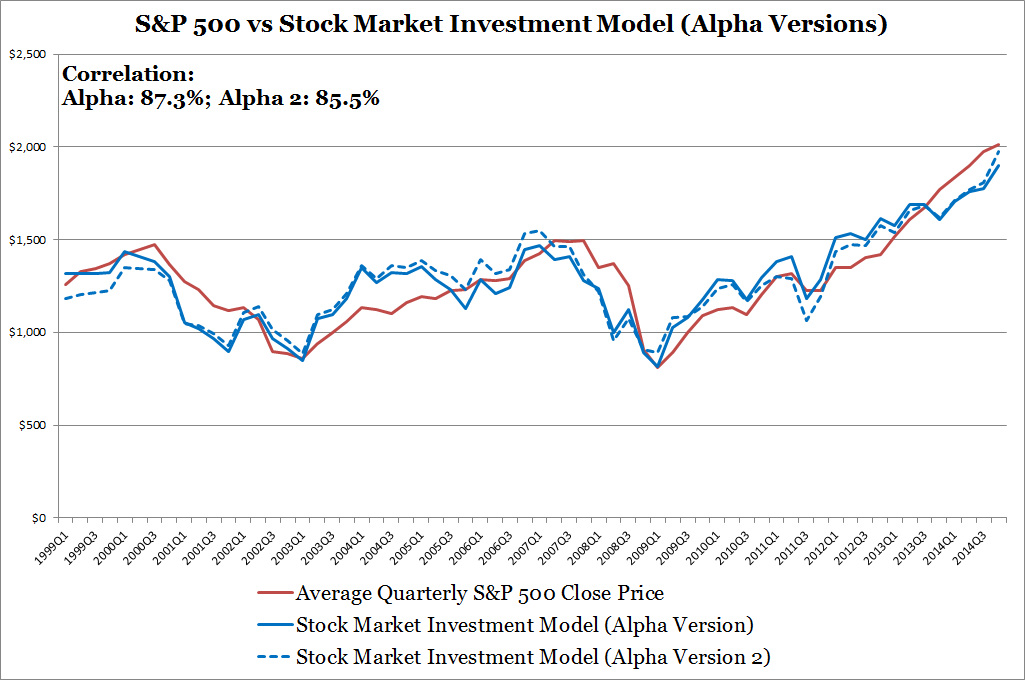
The SMIM U.S. GDP model's backtest correlation of 92.0% is even higher than it's 1999 - 2014 correlation of 85.5% reported on my previous blog. This star model may not be as effective in the future as S&P 500 companies' increasing reliance on international sales and business for earnings.
Despite the good correlation which means that they move in the same direction, the price movement magnitude is off. Too high in the 1970s and 1980s and too low between 1994 and 1998. I thought the consumer sentiment index would take care of this, but looks like the SMIM U.S. GDP model needs more help.
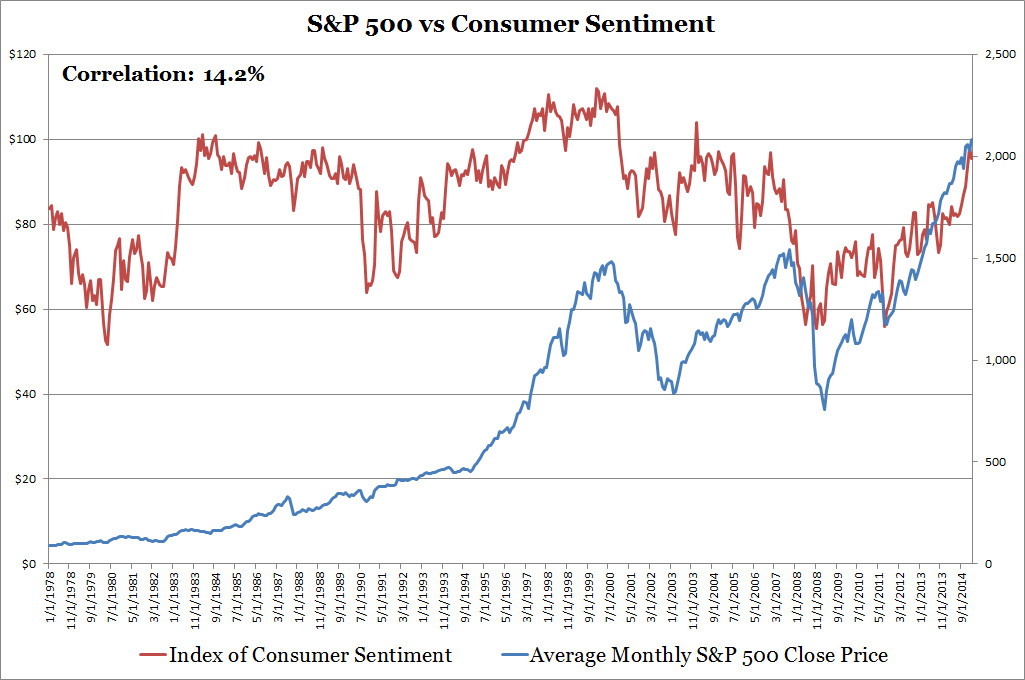
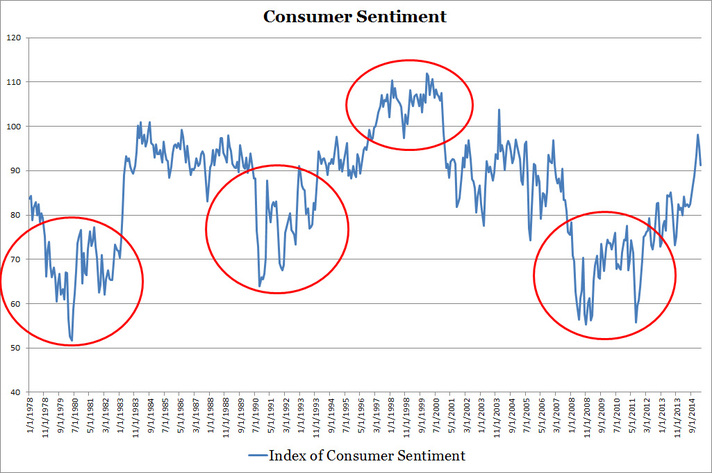
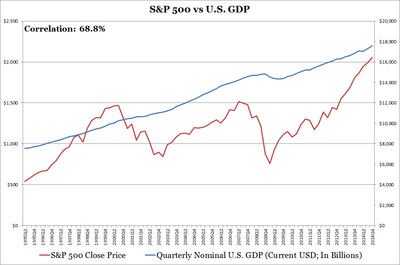
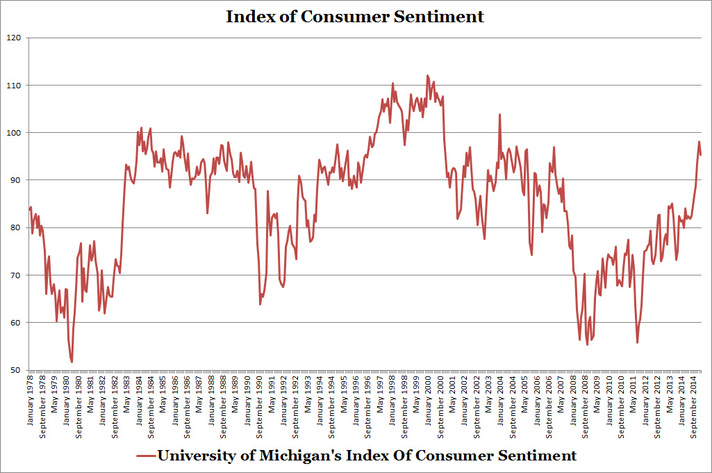
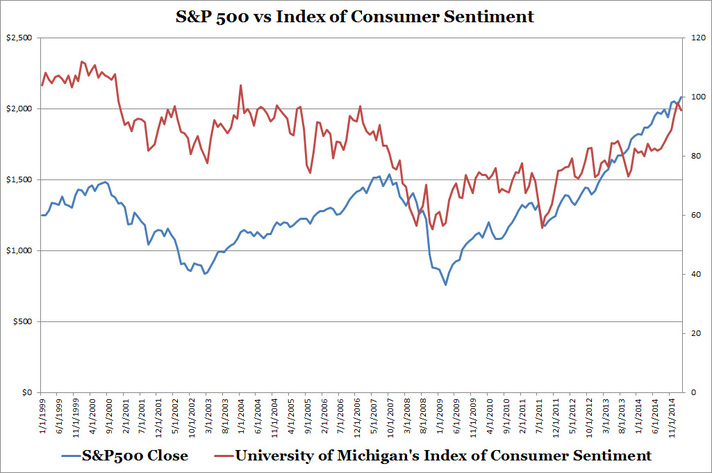
Let's start by looking at the available historical data: S&P 500 versus the Consumer Sentiment and U.S. GDP in the two charts below. It's easier to see that S&P 500 and U.S. GDP are highly correlated at 95% over 60 years since they both go up exponentially. In the shorter term it's hard just using GDP to project S&P 500 performance. This is where The Index of Consumer Sentiment comes in to help track the movement magnitude. I will discuss why the black circle is on the S&P 500 vs U.S. GDP chart further down.
Let's start by looking at the available historical data: S&P 500 versus the Consumer Sentiment and U.S. GDP in the two charts below. It's easier to see that S&P 500 and U.S. GDP are highly correlated at 95% over 60 years since they both go up exponentially. In the shorter term it's hard just using GDP to project S&P 500 performance. This is where The Index of Consumer Sentiment comes in to help track the movement magnitude. I will discuss why the black circle is on the S&P 500 vs U.S. GDP chart further down.
The data I used relates more to the broader economy so it makes sense the model underestimates stock market prices during the Dot Com era. Finding a way to fully account for stock market movements during the Dot Com era may not be necessary since it was primarily caused by the irrational advance and subsequent decline of technology stocks. If my model was spot on for the Dot Com era I might question its accuracy as well. I have some more work to solve the movement magnitude issue and I do have a few data sources I can review.
- Inflation - Notice the black circle on the S&P 500 vs U.S. GDP chart above, this is a period of high inflation from the late 1970s oil shock. At the moment I'm using nominal GDP figures as it was my theory that inflation is priced into the stock market. However, that might not have been the case in the 1970s and during the elevated inflation in the 1980s compared to the years after 1990. Adjusting this could bring model results closer to S&P 500 prices in the early years.
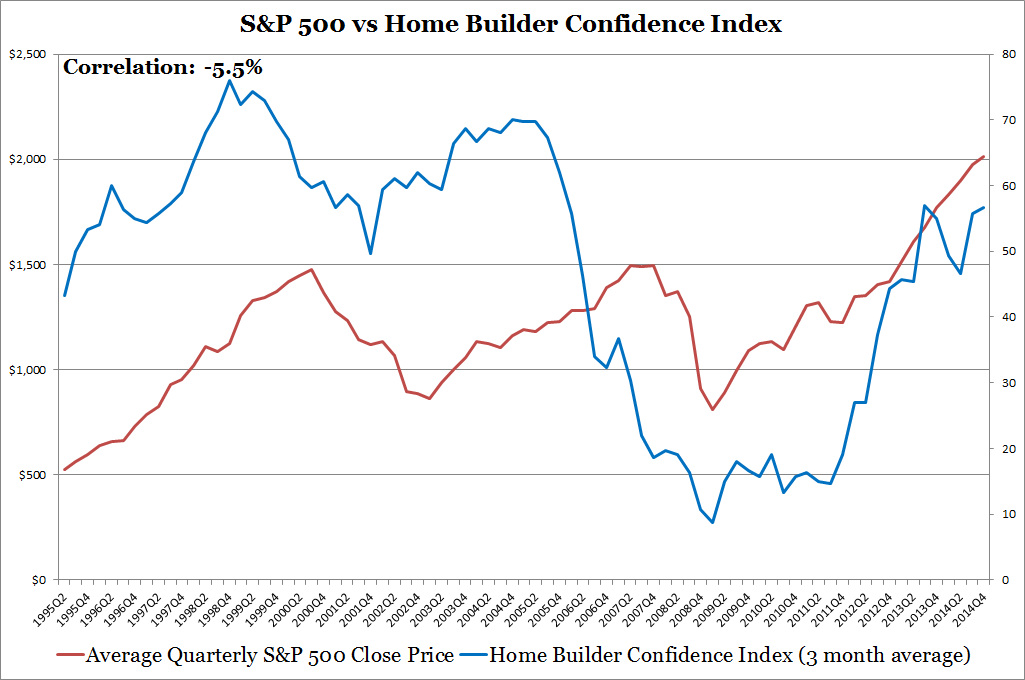
- Home Builder's Index - This could help as a leading index
- Investor Sentiment Index - If I can get a hand on a data set. This could help explain the Dot Com period miss.
- Volatility Index - I took a quick look at the data and the results look helpful for explaining stock market performance.
- S&P 500 trading volume - I looked at this on Saturday, I didn't see any observable patterns but I will keep it on the list.
- NASDAQ versus S&P 500 valuations - This will likely help explain the Dot Com bubble but I prefer not to use a stock market index to estimate another stock market index because they are sensitive to many of the same variables.
- Past GDP/Stock Market Performance - The stock market is subject to periods of momentum where gains fuel more gains and losses fuel more losses. I will look into this.
Tentatively, I will have both SMIM World GDP and SMIM U.S. GDP in development. They will be used to help project stock market performance and support my other two investment models, but I will review model results carefully and let readers know the models calculations and results can change. When I get chance I will create a Stock Market Investment Model page on Adrian's Investment Models.
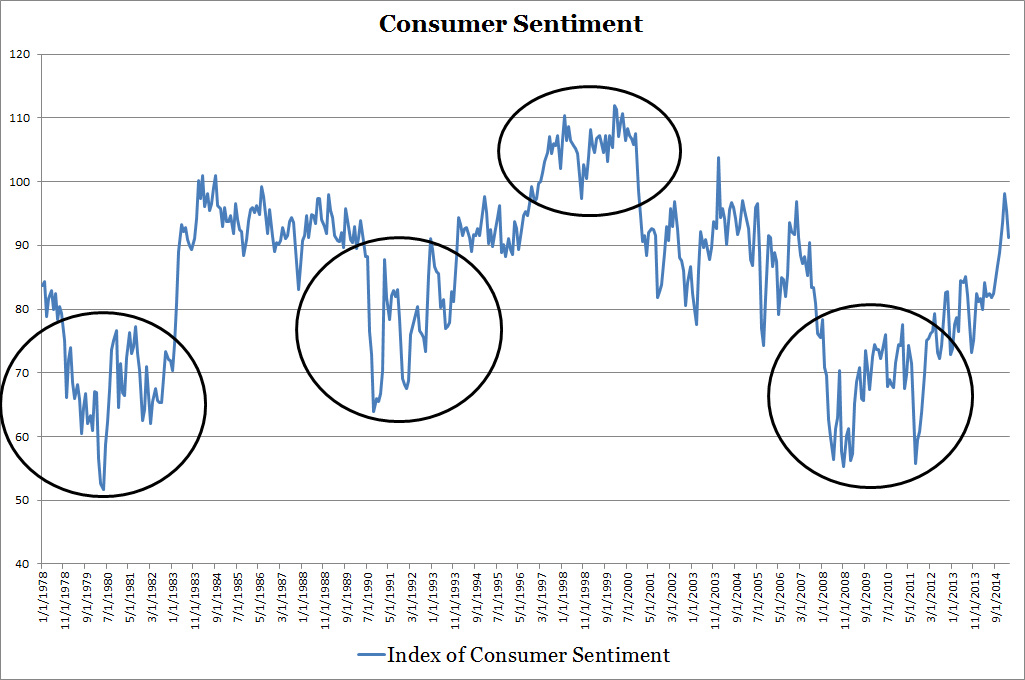
Although it is frustrating to spend an entire Saturday backtesting and increasing model accuracy, predicting stock market performance has always been difficult. If it is easy we wouldn't have an entire industry looking at stock investments. All is not lost, I learned that over the long term (5-20 years) the stock market is driven by GDP with much of the shorter term fluctuations explained by consumer sentiment. Investors should focus on a long term buy and hold strategy with an eye on increasing purchases when consumer sentiment is low (below 90) and decreasing purchases or modestly trimming positions when consumer sentiment is high (above 100). Here's a hint below. The best way to act on this is to focus on the widely available S&P 500 ETFs (such as SPY) and mutual funds (such as VFINX). Even broad market based ETFs and mutual funds work as well.
Although it is frustrating to spend an entire Saturday backtesting and increasing model accuracy, predicting stock market performance has always been difficult. If it is easy we wouldn't have an entire industry looking at stock investments. All is not lost, I learned that over the long term (5-20 years) the stock market is driven by GDP with much of the shorter term fluctuations explained by consumer sentiment. Investors should focus on a long term buy and hold strategy with an eye on increasing purchases when consumer sentiment is low (below 90) and decreasing purchases or modestly trimming positions when consumer sentiment is high (above 100). Here's a hint below. The best way to act on this is to focus on the widely available S&P 500 ETFs (such as SPY) and mutual funds (such as VFINX). Even broad market based ETFs and mutual funds work as well.



 RSS Feed