*Disclosure: I don't hold or plan to trade any of the mutual funds or ETFs mentioned in this blog within the next 48 hours.
Sources: Yahoo Finance, US Census Bureau
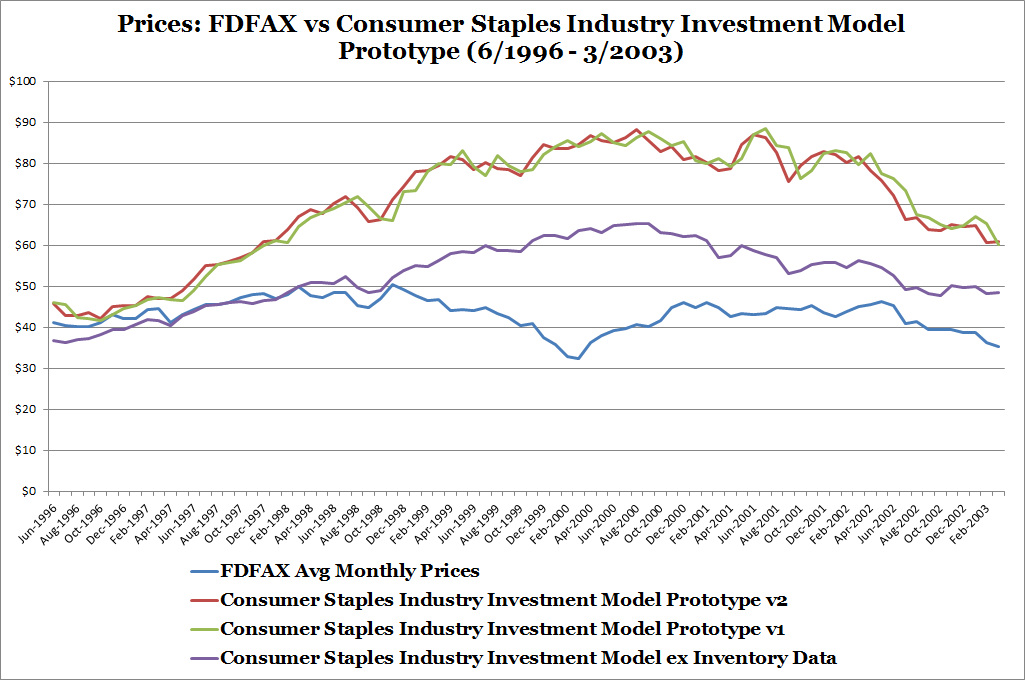
Last time, I had a few theories of what might explain the divergence between model backtesting results versus FDFAX from 6/1996 to 3/2003:
Let's look at each of the theories.
Statement 1:
Consumer staples companies have fallen out of favor versus other industry stocks during the time, most likely technology stocks.
The dot com boom was known for the big share price increases of internet, software, and technology related companies and possibly a price drop in other types of companies, most likely those in consumer staples. I'm going to test the first part by comparing the Fidelity Select Technology Portfolio (FSPTX), Fidelity Select Software & Computer Portfolio (FSCSX), and Fidelity Select Consumer Staples Portfolio (FDFAX) with the S&P 500 Index. The chart slideshow below shows the high correlations of the technology and software portfolios but the very poor correlation of the consumer staples portfolio. This suggests that the S&P 500 Index, a proxy for stock market performance, is strongly influenced by dot com stocks. Stock market performance is an input into the Consumer Staples Industry Investment Model.
- Consumer staples companies have fallen out of favor versus other industry stocks during the time, most likely technology stocks.
- FDFAX's management made poor decisions in the late 1990s that detracted from investment performance but they recovered by the early 2000s.
- The Consumer Staples Industry Investment Model is incomplete.
- Something else.
Let's look at each of the theories.
Statement 1:
Consumer staples companies have fallen out of favor versus other industry stocks during the time, most likely technology stocks.
The dot com boom was known for the big share price increases of internet, software, and technology related companies and possibly a price drop in other types of companies, most likely those in consumer staples. I'm going to test the first part by comparing the Fidelity Select Technology Portfolio (FSPTX), Fidelity Select Software & Computer Portfolio (FSCSX), and Fidelity Select Consumer Staples Portfolio (FDFAX) with the S&P 500 Index. The chart slideshow below shows the high correlations of the technology and software portfolios but the very poor correlation of the consumer staples portfolio. This suggests that the S&P 500 Index, a proxy for stock market performance, is strongly influenced by dot com stocks. Stock market performance is an input into the Consumer Staples Industry Investment Model.
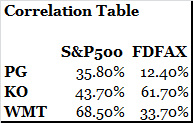
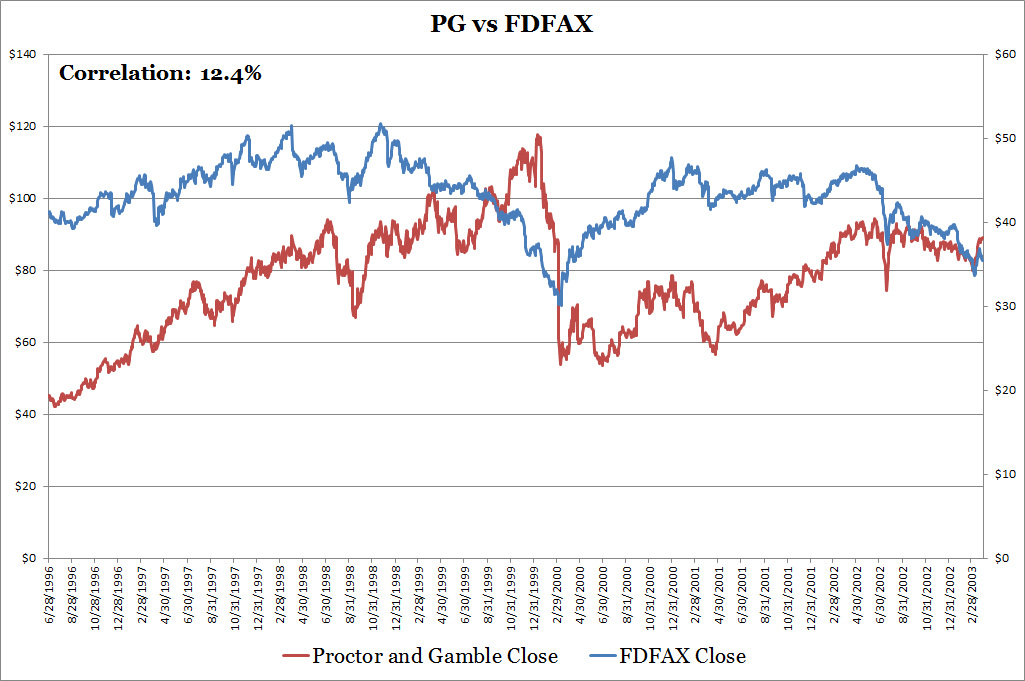
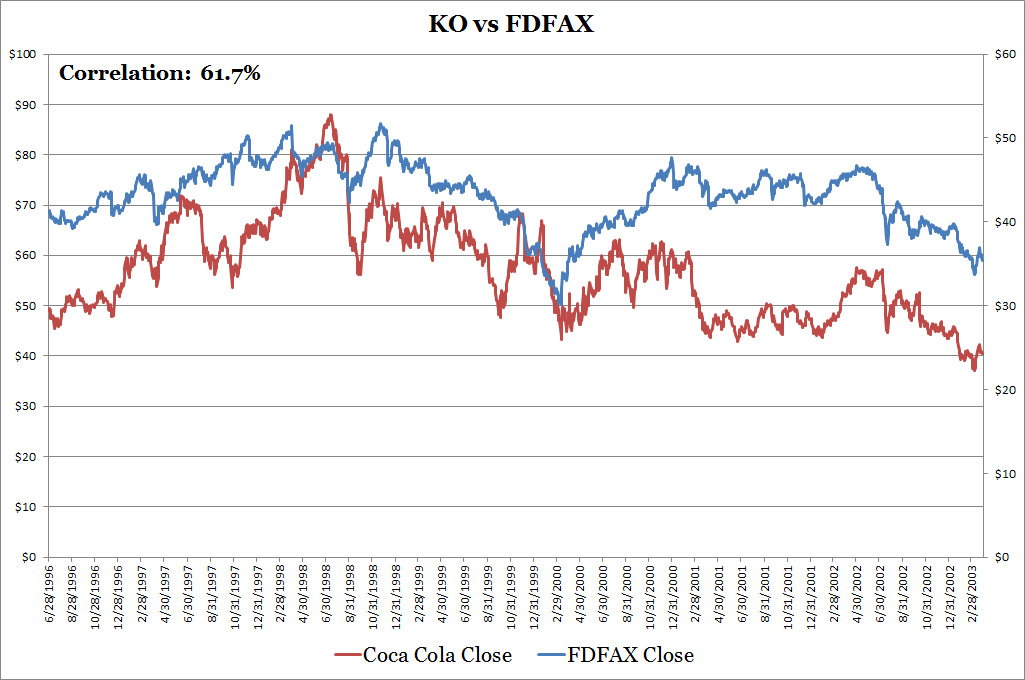
The second part is to dig into three very large consumer staples companies to uncover more clues. I picked Proctor and Gamble (PG), Coca-Cola (KO), and Wal-Mart (WMT). I first looked at whether their share price movement is correlated with the S&P500 and FDFAX. Successful results should indicate that all three stocks are more correlated with FDFAX than the S&P500, but this isn't the case here. Of the three stocks only Coca-Cola is highly correlated with FDFAX as shown in the correlation table below. But all three stocks are decently correlated with the S&P500 Index due to their status as large cap stocks. Therefore I can't say that these three large consumer staples stocks drive FDFAX performance.
Source: Yahoo Finance
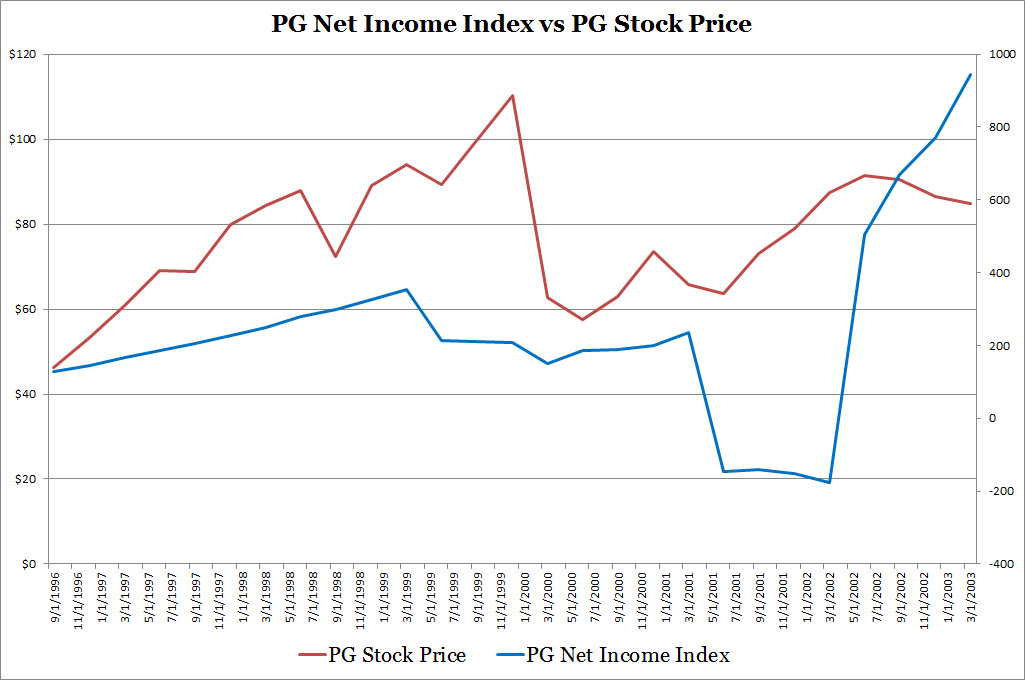
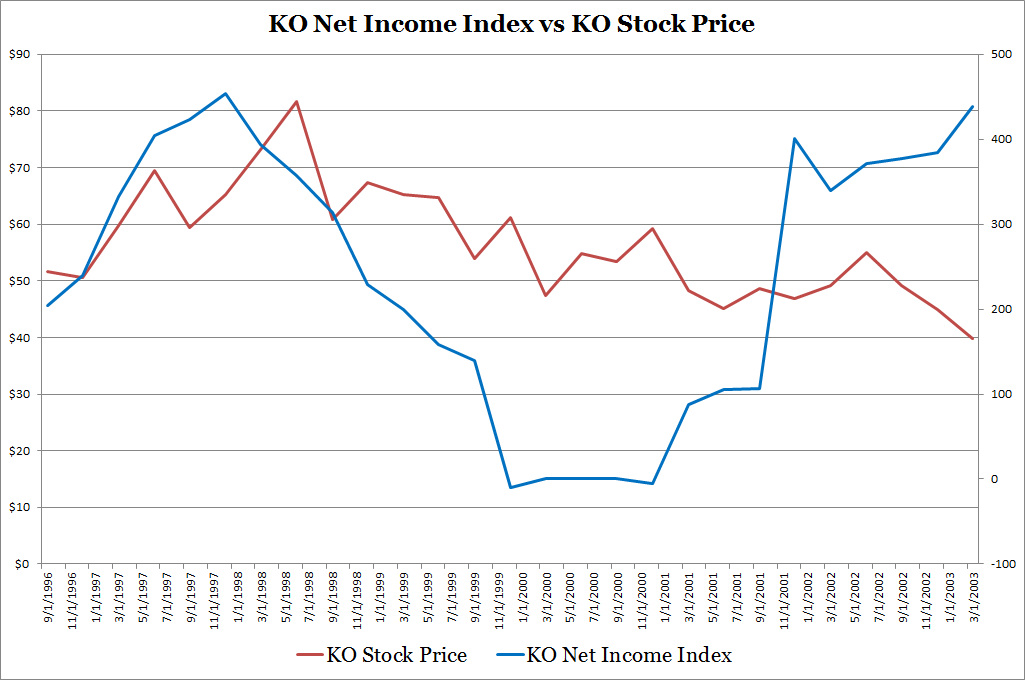
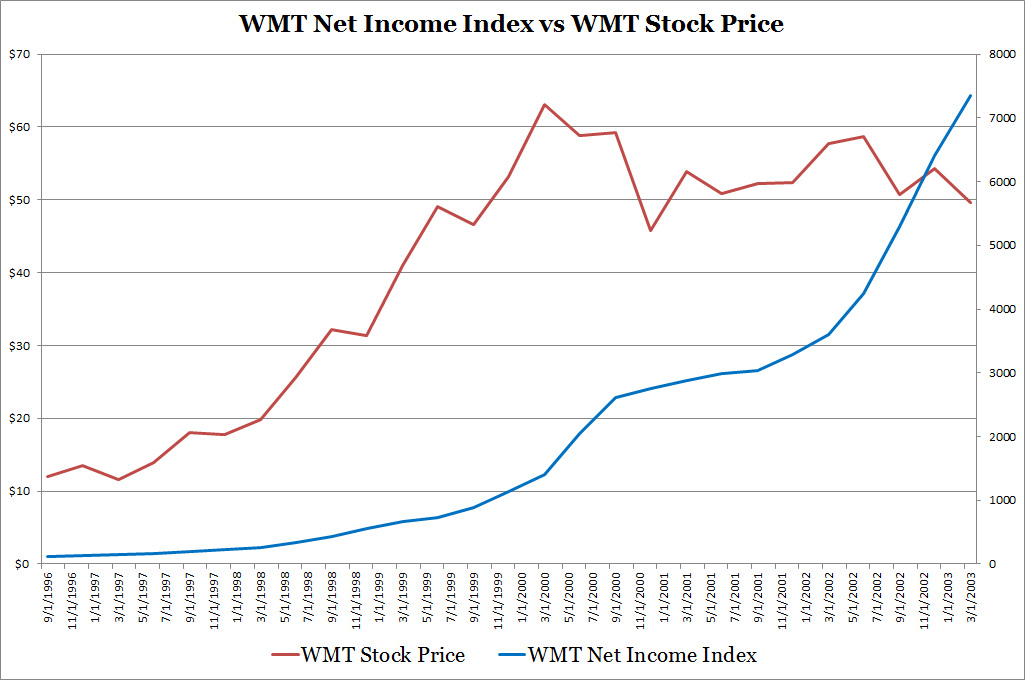
Also I wanted to see if their profitability and share price are related. The three charts below plots the three companies' share price with a net income index (seasonally adjusted growth). An increase in the index indicates that net income has grown and a decrease means the opposite. For the most part share prices follow net income growth but starting from the 2000s the link between net income and share prices diverge. Comparing to the first chart on this blog, PG and WMT doesn't display declining share prices from 1998 to 2000, WMT and KO doesn't show a rise from 2000 to 2001. Therefore, the net income and share price relationship doesn't help us answer statement 1 either.

In order to more conclusively test statement 1, I would need to test each industry's correlation with the S&P 500 to make sure the technology, software, and computer industries are the main drivers of general stock market performance during the dot com era. Another necessary action would be to obtain a list of portfolio holdings (both names and dollar amounts) for FDFAX and/or the morningstar consumer staples index so I can investigate and attribute individual security level factors to the fund/index performance. This is something I can add to my to-do-list.
Statement 2:
FDFAX's management made poor decisions in the late 1990s that detracted from investment performance but they recovered by the early 2000s.
This isn't true. The Morningstar Chart below shows the FDFAX and Morningstar's Consumer Defensive Index moving together. If poor decisions had a major impact we wouldn't see a good fit between FDFAX and the index.
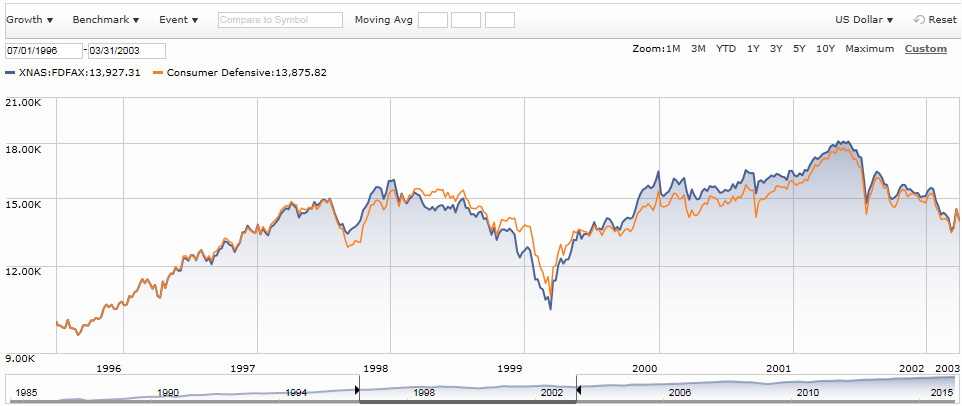
Source: Morningstar
Statement 3 and Statement 4:
The Consumer Staples Industry Investment Model is either incomplete or something else is happening.
There is a degree of raw truth in this statement. We can reason that if the model is complete we wouldn't see such an anomaly. In terms of consumer staples related data I used there could be a unique relationship between wholesaler and retail sales/inventory that I haven't discovered. For instance the slight improvement in accuracy of the prototype V2 model over the V1 model is due to an adjustment in the way the model interprets wholesale inventory data.
The dot com boom was a period of irrationality as any company technology related increased in price. This rapid ascent also influenced the S&P 500 as many technology companies were members. From July 1, 1996 to December 1, 2001, the S&P 500 Price to Earnings ratio went from 18.26 to 46.37. There exist a possibility that factors other than consumer staples related data hurt performance during this period such as inflation, interest rates, mutual fund flows, imports/exports of retail products. For future model enhancement I will consider these data points for testing.
With such a big miss during the dot com boom does this mean the Consumer Staples Industry Investment Model can't be used?
Although the model fails during the dot com era, the chart below shows that the prototype model is an effective predictor of FDFAX after the dot com era. The model as usable despite its misses in the dot com era. No investment model is perfect and model results always needs to be reviewed before using. This is what I'll do on this website every week when I release model results. I plan on releasing model results either today if I have time or starting next week.
Although the model fails during the dot com era, the chart below shows that the prototype model is an effective predictor of FDFAX after the dot com era. The model as usable despite its misses in the dot com era. No investment model is perfect and model results always needs to be reviewed before using. This is what I'll do on this website every week when I release model results. I plan on releasing model results either today if I have time or starting next week.

Sources: Yahoo Finance, US Census Bureau
 RSS Feed