*Disclosure: I don't hold or plan to trade any of the securities mentioned in this blog within the next 48 hours.
On 1/17/2015 I completed my backtest of the Energy Industry Investment Model. However, I'm going back to revisit the backtesting process and results in light of what I learned conducting the Consumer Staples Industry Investment Model backtest.
Fixed a statistical mistake
I narrowed the price gap between the Fidelity Select Energy Portfolio (FSENX) compared with the Energy Industry Investment Model with correlation remaining at 91.3%. Previously I didn't adjust the model based on the starting position of the data set correctly. This adjustment shifts the entire model results up linearly but doesn't affect the underlying model mechanics. The result is improved price accuracy as evidence. See charts below.
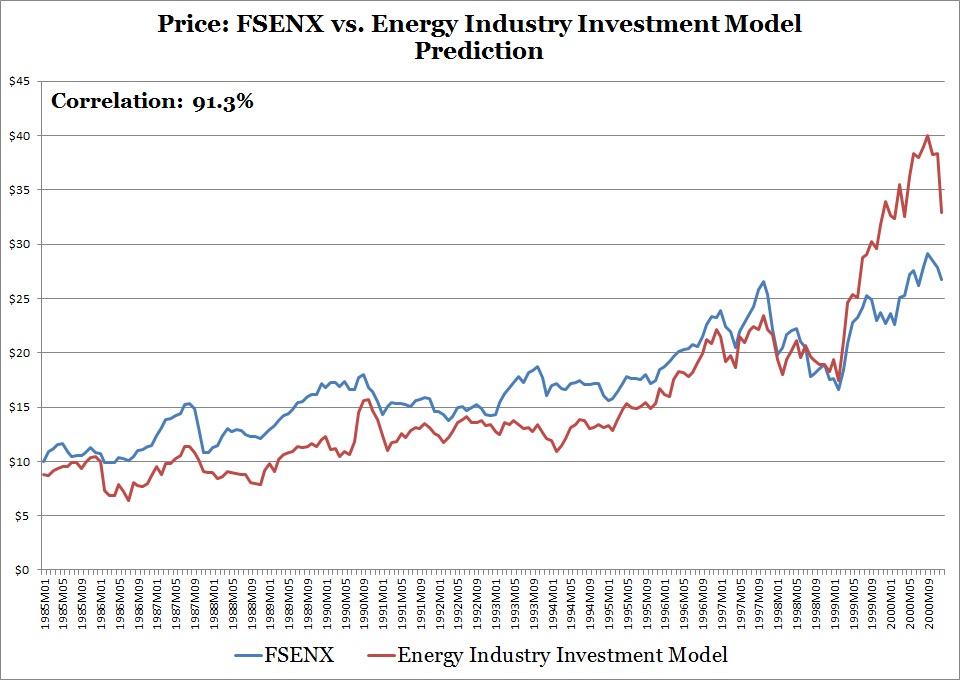
Sources: EIA, Yahoo Finance, World Bank
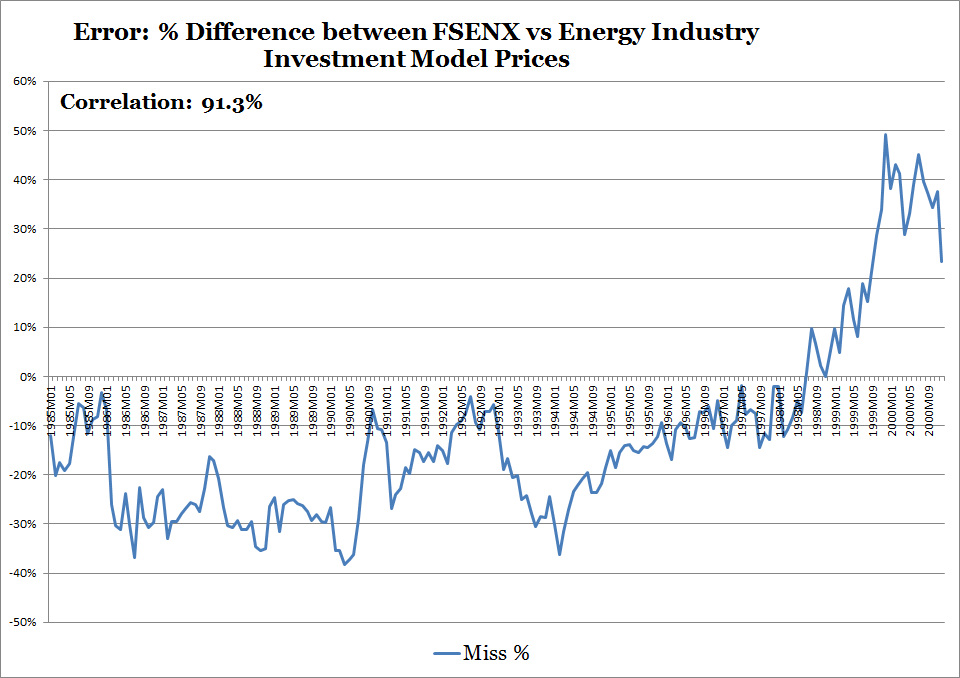
Sources: EIA, Yahoo Finance, World Bank
91.3% Backtesting results are good but not good enough for me
I want to aim for a 95% correlation backtesting result. The model results have a very strong 97% correlation with the Energy Select Sector SPDR ETF (XLE) from 1998 to 2014. Modeled prices move in a similar fashion but are consistently below FSENX prices during the 1980s and consistently above FSENX prices during the dot com era (1998 - 2000). Future model enhancements will likely increase model backtesting results. I'm going to concentrate my efforts reviewing data in the following areas:
I want to aim for a 95% correlation backtesting result. The model results have a very strong 97% correlation with the Energy Select Sector SPDR ETF (XLE) from 1998 to 2014. Modeled prices move in a similar fashion but are consistently below FSENX prices during the 1980s and consistently above FSENX prices during the dot com era (1998 - 2000). Future model enhancements will likely increase model backtesting results. I'm going to concentrate my efforts reviewing data in the following areas:
- Crude Oil Consumption, Stocks
- Petroleum Products Statistics: Gasoline, Fuel Oil, Jet Fuel
- Natural Gas Statistics
- Refinery Statistics
 RSS Feed