I was hoping to finish my Stock Market Investment Model last weekend so I can use it for the Consumer Staples Industry Model. Although I wasn't able to finish it, I made enough progress to run the current version of the model with a few minor adjustments. I'm going to feed a GDP forecast through to get model results. Knowing where the stock market may be going will help determine where the consumer staples industry as represented by the Consumer Staples Select Sector SPDR ETF (XLP) is heading. I have finishing the consumer staples article as my must do item this weekend. I will review the data I to build my article. Below is an updated retail sales chart I will likely use for the article. It highlights the lower volatility of consumer staples retail sales, especially during the Great Recession, versus the rest of the retail industry.
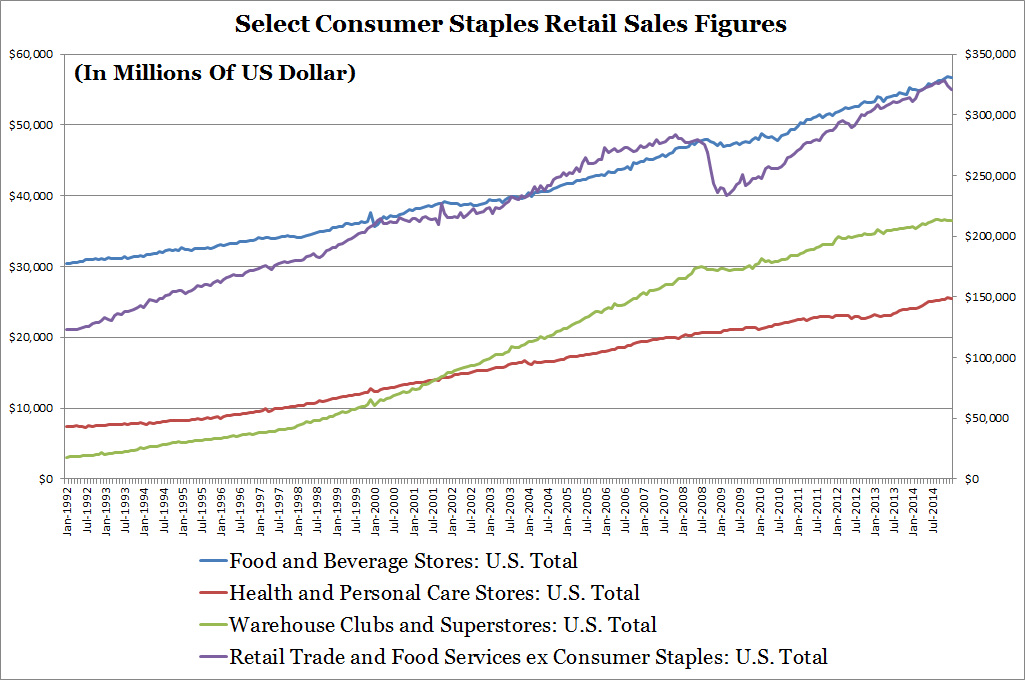
Source: U.S. Census Bureau
As a side note, my models are adaptable and can be built on top of other ETFs and mutual funds. I did this for the Consumer Staples Industry Investment Model backtest, I used the Fidelity Select Consumer Staples Portfolio (FDFAX) due to limited XLP historical data. Adding the model on top of other products will be a project for another time.
After the consumer staples article is posted, I want to write about the energy industry again. I haven't thought of a topic yet. Today, I read in the news that weekly U.S. crude oil production fell from 9.42 to 9.39 million It isn't much compared to the rise in production over the last few years. Here is a quick historical chart of weekly crude oil production and stocks where today's drop isn't big enough to see. The red line is the much publicized issue of rising crude oil stocks.
After the consumer staples article is posted, I want to write about the energy industry again. I haven't thought of a topic yet. Today, I read in the news that weekly U.S. crude oil production fell from 9.42 to 9.39 million It isn't much compared to the rise in production over the last few years. Here is a quick historical chart of weekly crude oil production and stocks where today's drop isn't big enough to see. The red line is the much publicized issue of rising crude oil stocks.
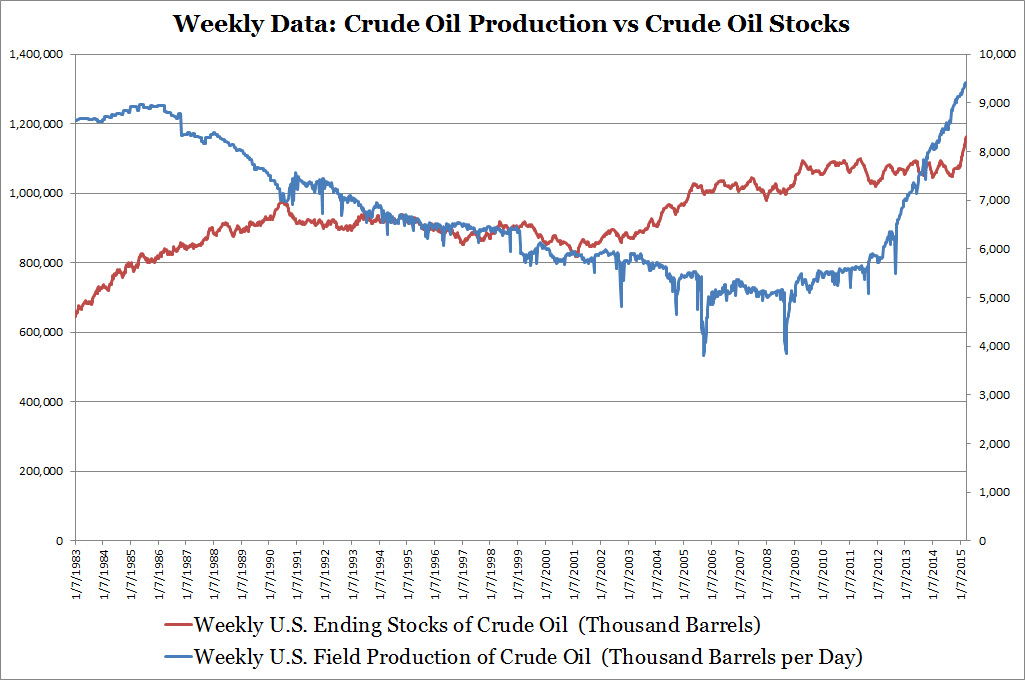
Source: EIA
In terms of my list, I added building a semi/fully automated energy industry database to pull in EIA and other energy industry data. Having this database will streamline the process of researching and writing.
My outstanding to-do-list in order of priority:
Thank you for reading.
My outstanding to-do-list in order of priority:
- Finish my article: "Is The Consumer Staples Industry Just Spinning My Wheels?".
- Build the Stock Market Investment Model (tweaking and more backtesting).
- Finish building the Consumer Discretionary Industry Investment Model.
- Investigate why the price estimate of my Energy Industry Investment Model is much lower than the Energy Select Sector SPDR ETF's (XLE) price. I'm looking for evidence to support my hypothesis that dividend investors are propping up energy industry stocks.
- Investigate dot com era, dot com crash, and subsequent recovery effects on both the energy and consumer staples industry investment models.
- Investigate why merchant wholesaler inventory levels affects consumer staples industry stocks. I suspect two reasons: higher merchant wholesaler inventory levels equate to higher profit margins for consumer staples retailers or inventory levels is a result of future sales expectations.
- Write an article about lessons I learned from Mohegan Sun casino.
- Write an article about how to identify stock market tops.
- Build an energy industry database to assist in research and writing
Thank you for reading.
 RSS Feed