What is the best way to forecast S&P 500 movements? I've always been hesitant to estimate stock market performance. I prefer to focus on simpler areas such as industries and individual stocks. The stock market is so complex that estimating it will be difficult. Since I started Adrian's Investment Models, I realized that stock market performance is a significant input for my industry investment models, therefore it would be immensely helpful to create a stock market investment model. I believe in using fundamental data to look at the economy, industries, and stocks. However, the growing field of behavioral finance looks into how the stock market is not as efficient and anchored in fundamental data as previously thought. Therefore, by looking into both fundamental and "behavioral finance" data in the potential creation of an S&P 500 model we will learn more about whether the S&P 500 is guided by fundamental data or behavioral tendencies.
I see the S&P 500 as two components. The first is 500 S&P 500 member companies' level of earnings. The second is the price to earnings (P/E) ratio or "market multiple". Level of earnings multiplied by P/E produces the S&P 500 price. I would need to find data that represents earnings and P/E.
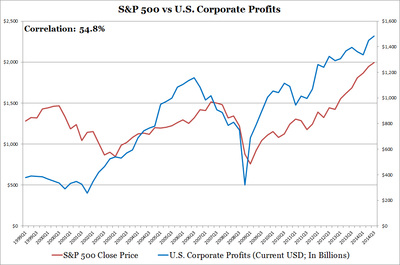
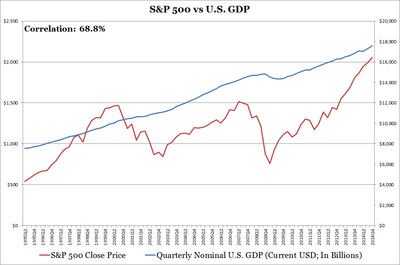
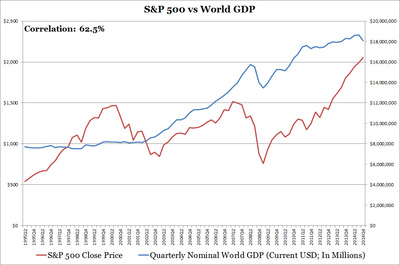
As a student in finance the first things that came to mind regarding predicting stock market performance is GDP or corporate earnings. This is logical since companies are invested in the economy. Please see the below three charts for how U.S. Corporate Profits, U.S. GDP, World GDP track the S&P 500. Click to enlarge the image.
U.S. Corporate Profits, with a lower correlation versus both U.S. and World GDP, shows sufficient variation and seems to be a better fit. Visually, U.S. GDP does a poor job explaining S&P 500 volatility while World GDP has some variation. I don't find any of these a great fit alone. Let's look at some potential data for P/E.
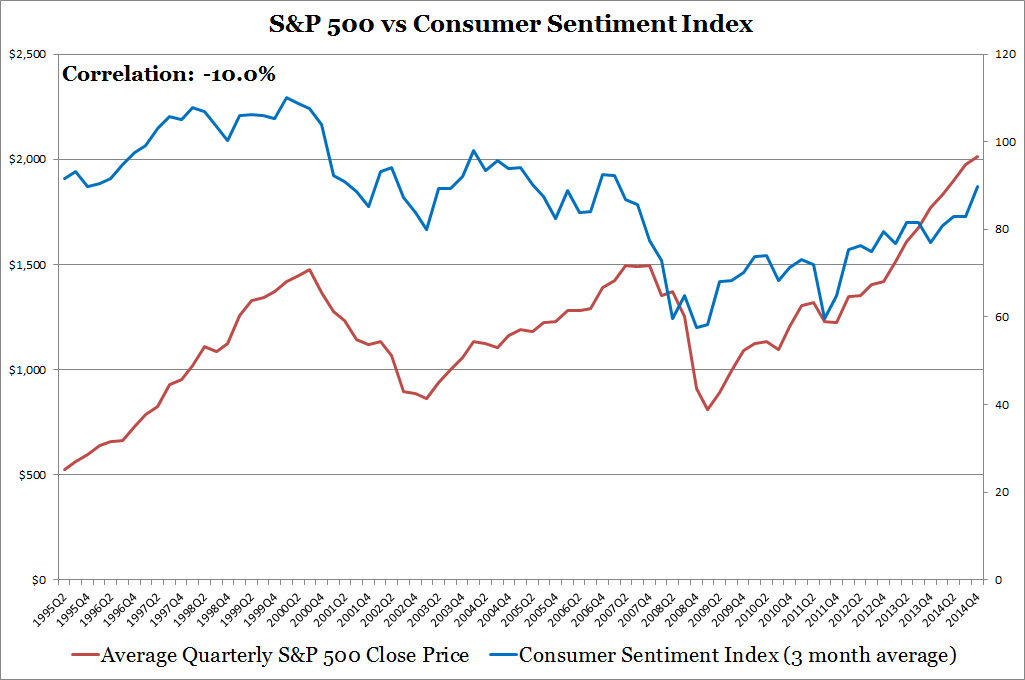
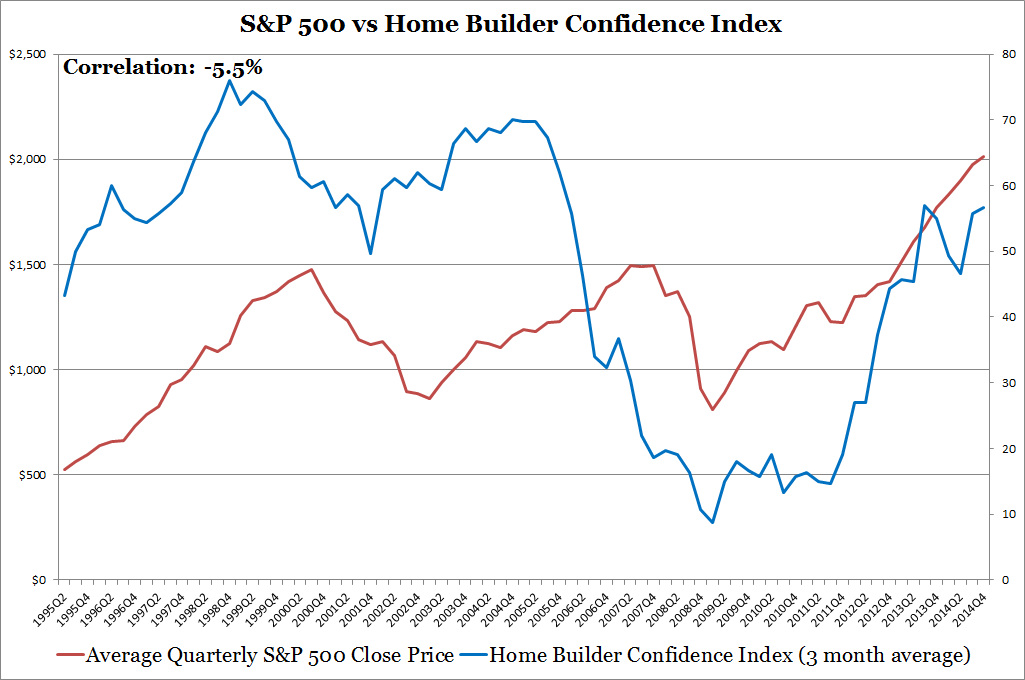
Going back to my classroom days, I learn that stock prices factor future expectations. I found a loose relationship (48.1% correlation) between S&P 500 P/E and the GDP growth path. This makes sense as the economy keeps growing the P/E rises while an economic contraction lowers P/E. In order to find a better fit and a different variable, I wondered if behavioral tendencies such as confidence, momentum, herding, gambler's fallacy may explain P/E. This data would be hard to find as it would be crazy if I polled random investors on the street and asked them if they let confidence guide their investment decisions, if they suffer from gambler's fallacy, or exhibit herding behavior. The only data sources I knew that could indicate behavior tendencies are not on the investor related but consumer and home builder related. I turned to the Consumer Sentiment and Home Builder Confidence Indices. These sources are not completely irrational since respondents are likely informed of current events but their analysis may be different/flawed due to imperfect information, unique individual opinions/feelings, and individual confidence. Charts below.
Going back to my classroom days, I learn that stock prices factor future expectations. I found a loose relationship (48.1% correlation) between S&P 500 P/E and the GDP growth path. This makes sense as the economy keeps growing the P/E rises while an economic contraction lowers P/E. In order to find a better fit and a different variable, I wondered if behavioral tendencies such as confidence, momentum, herding, gambler's fallacy may explain P/E. This data would be hard to find as it would be crazy if I polled random investors on the street and asked them if they let confidence guide their investment decisions, if they suffer from gambler's fallacy, or exhibit herding behavior. The only data sources I knew that could indicate behavior tendencies are not on the investor related but consumer and home builder related. I turned to the Consumer Sentiment and Home Builder Confidence Indices. These sources are not completely irrational since respondents are likely informed of current events but their analysis may be different/flawed due to imperfect information, unique individual opinions/feelings, and individual confidence. Charts below.
At first glance the correlation figures suggest no relationship between the S&P 500 and the consumer and home builder indices. Visually, the Consumer Sentiment Index loosely tracks the S&P 500 close price while the Home Builder Confidence seems to lead the S&P 500 by a few quarters. My concern with the Home Builder Confidence Index is that builders would be more influenced by residential market dynamics rather than the general economy. The Consumer Sentiment Index is more appropriate since consumer spending is 70% of U.S. GDP.
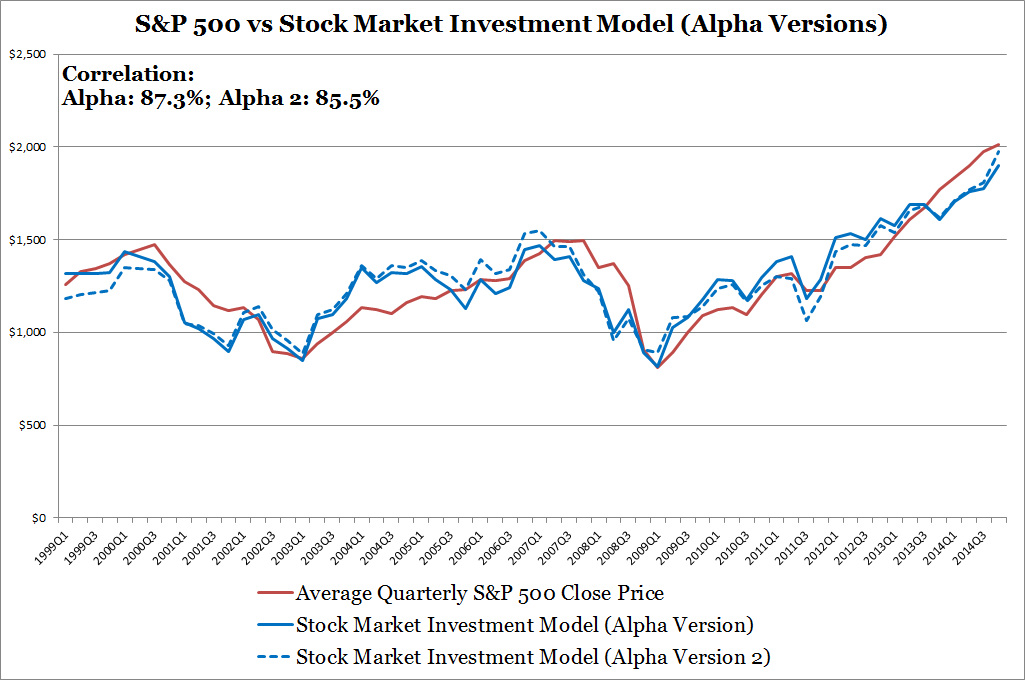
Taken alone none of these data sources help figure out the S&P 500, I decided to use both the GDP data with the Consumer Sentiment Index and what I found was astounding. Let me formally introduce you to two alpha versions of my Stock Market Investment Model below. The original version uses World GDP with the Consumer Sentiment Index while the second version uses U.S. GDP with the Consumer Sentiment Index. Correlations and visual fit increased dramatically. GDP provides the general S&P 500 price trend while the Consumer Sentiment Index provides the volatility.
Taken alone none of these data sources help figure out the S&P 500, I decided to use both the GDP data with the Consumer Sentiment Index and what I found was astounding. Let me formally introduce you to two alpha versions of my Stock Market Investment Model below. The original version uses World GDP with the Consumer Sentiment Index while the second version uses U.S. GDP with the Consumer Sentiment Index. Correlations and visual fit increased dramatically. GDP provides the general S&P 500 price trend while the Consumer Sentiment Index provides the volatility.
When evaluating future stock market performance Investors should start paying closer attention to the Consumer Sentiment Index as GDP movements are far less volatile. In my previous chart I showed consumer sentiment reaching 1999 levels. For the past few years the Consumer Sentiment Index is rising towards 1999 levels which is an early indication of an approaching market top and slower pace of stock market increases. I wouldn't immediately start selling because consumer sentiment even at high index levels (around 90+) tends to hang around for a while before dropping. Identifying a market top sounds like an idea for a future blog entry.
Now that you know to take a look at GDP but paying special attention to the Consumer Sentiment Index, you can cheaply and efficiently trade S&P 500 ETFs when the time is right. Some examples include the S&P 500 SPDR ETF (SPY), Vanguard S&P 500 ETF (VOO), and iShares Core S&P 500 ETF (IVV). Most large mutual fund companies also have S&P 500 index funds as well.
Going back to the stock market model, the next step is to backtest the two alpha versions and conduct additional research into more variables or develop techniques to further increase accuracy. I'm debating whether to dedicate a webpage to the Stock Market Investment Model. Thanks for reading, I hope to show you some backtesting results soon.
 RSS Feed