*Disclosure: I don't hold or plan to trade any of the securities mentioned in this blog within the next 72 hours.
This week lets look at U.S., Canada, and World ex U.S. and Canadian rotary rigs and crude oil production data. I only have international EIA data from 1994 to October 2014, so the information is a bit dated. However, it is enough to show that neither U.S. nor Canadian rotary rig count are closely related to crude oil production as shown in the first exhibit below. This puzzles me, but this is what the data says. The strange trend continues for the U.S. market, Baker Hughes' U.S. rig count fell from around 1,925 rigs in October to 1,348 in February while the EIA reports crude oil production went from 9.0 million barrels/day to over 9.3 million barrels/day. The second chart shows that World ex U.S. and Canadian rigs and crude production are closely related. I'm not sure why World ex U.S. and Canada data makes more sense than U.S. and Canadian data. Investors should be reminded that each market is different and to look at the data and not simply rely on rules of thumb.
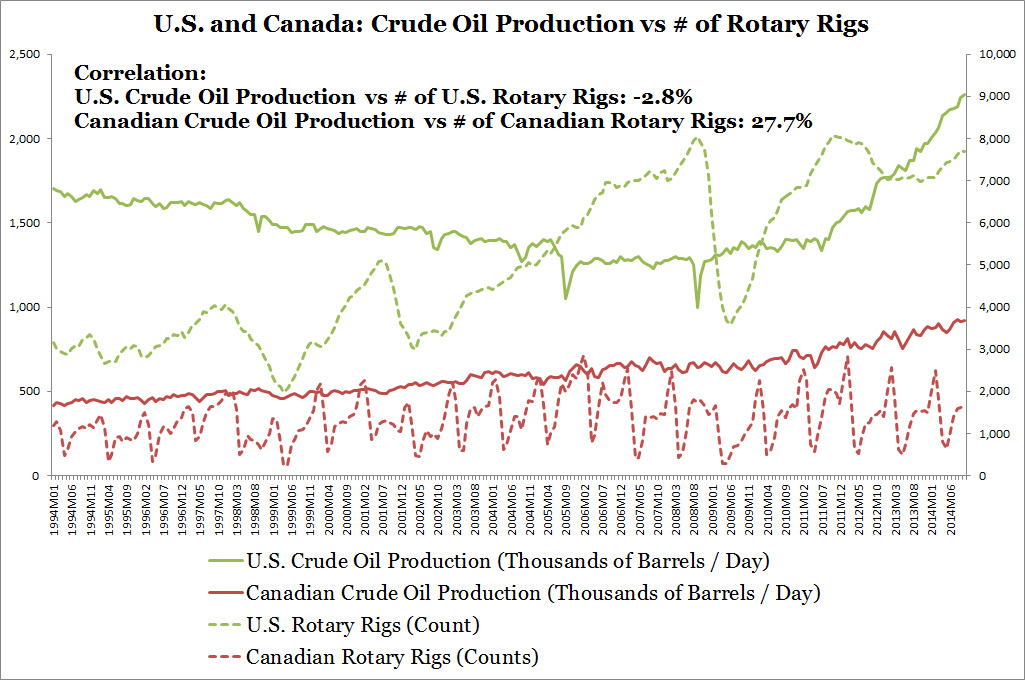
Sources: Baker Hughes, EIA
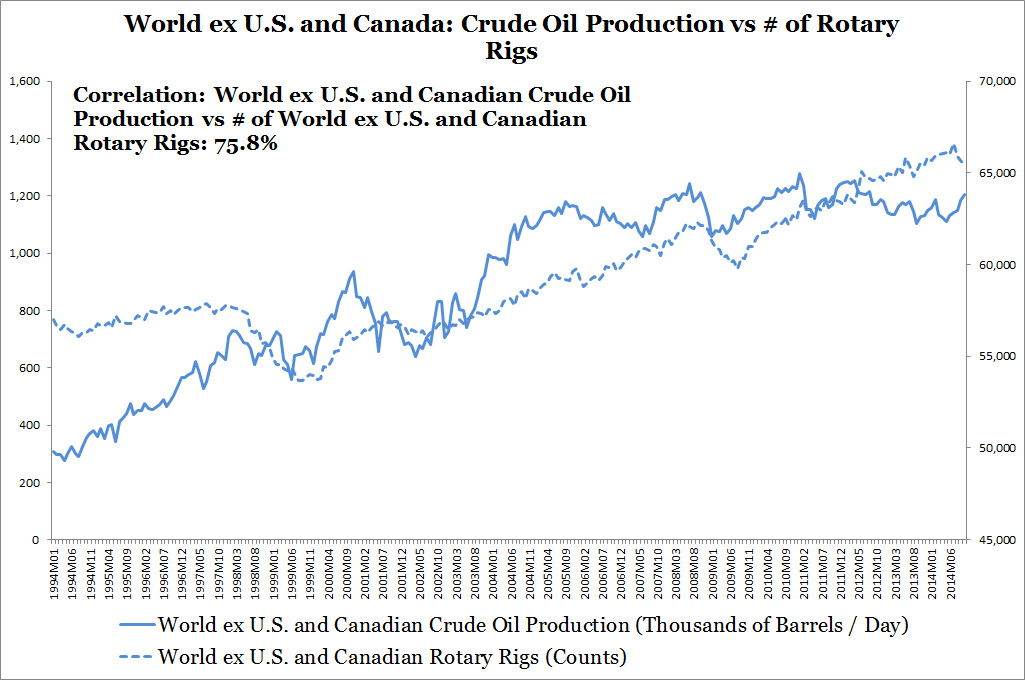
Sources: Baker Hughes, EIA
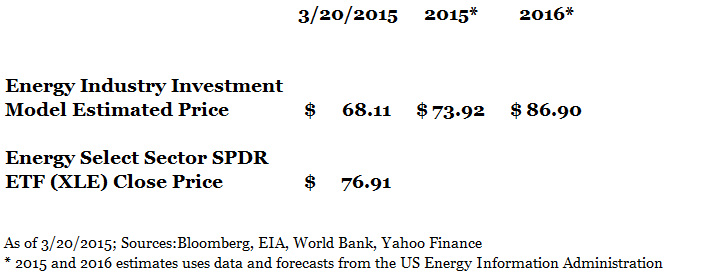
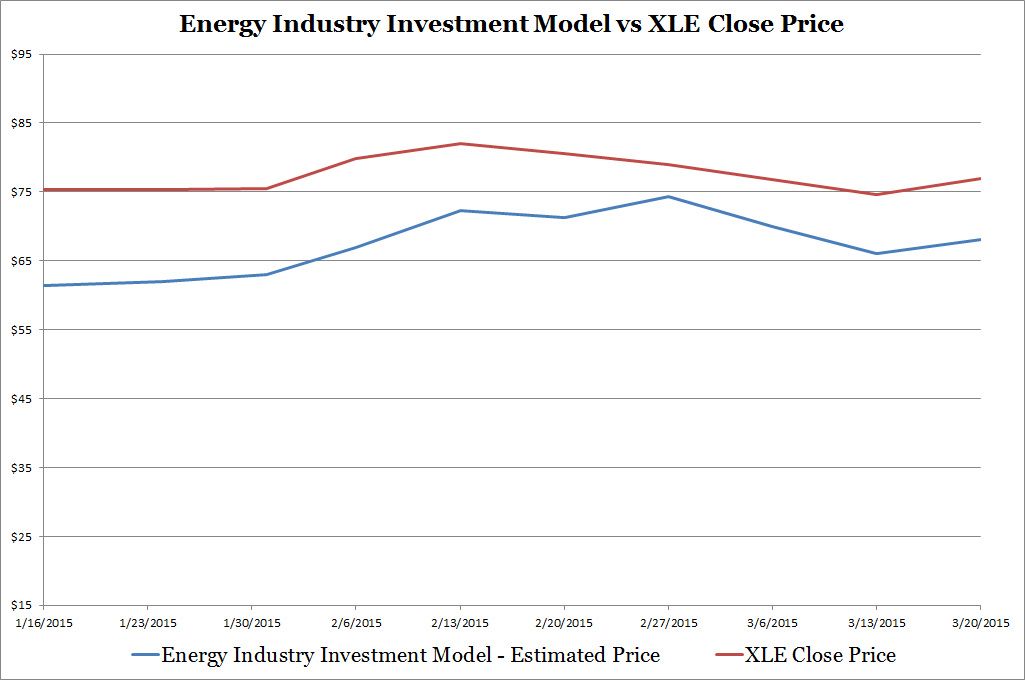
Energy investors are right to wonder where the market is going. This week oil prices continue to stay around $50/barrel. EIA's U.S. crude oil production for the week of March 13, 2015 reached another record high of 9.42 million barrels/day going up 6 weeks in a row from 9.12 million barrels/day during the week of January 30, 2015. Crude oil production has been above the 9 million/day range since November 2014. My Energy Industry Investment Model takes into account historical relationships between crude oil prices, crude oil and petroleum product production, and stock market performance estimates the Energy Select Sector SPDR ETF's (XLE) price. This week the model predicts a slight price increase to $68.11 from last week's $66.05 estimate. The increase this week is attributed to rebounding stock market performance. XLE's closing price on 3/20/2015 moved up to $76.91 from $74.63 last week as shown in the chart below. 2015 and 2016 prices use the U.S. Energy Information Administration Short-Term Energy Outlook projections as inputs for the model.
I developed the Energy Industry Investment Model in early January and weekly updates are available on my website. I plotted how my estimates are holding up against XLE's prices below. The gap between my model estimates and XLE's price can either be an indication of an inaccurate model or that XLE's prices are overvalued.
Sources: Bloomberg, EIA, World Bank, Yahoo Finance
Although no model is perfect I did my best to build it. As mentioned before the Energy Industry Investment Model relies on historical relationships between crude oil prices, crude oil and petroleum product production, and stock market performance. The model was built with data from the Great Recession which considers stress events and was backtested during the 1980s oil glut.
My theory is that dividend investors are keeping XLE's prices higher than fundamental value, but I also need to conduct more research to support this view. Bottom feeding investors could also be propping up energy stocks as well, but I haven't done extensive research on it. Let's see what happens during next quarter's earning calls.
I will be moving away from scheduled weekly blog posting on the energy industry but I'll keep supplying short weekly updates on the energy page of my website and of course I shall publish a piece if there are any noteworthy changes in the industry/model/model results.
 RSS Feed