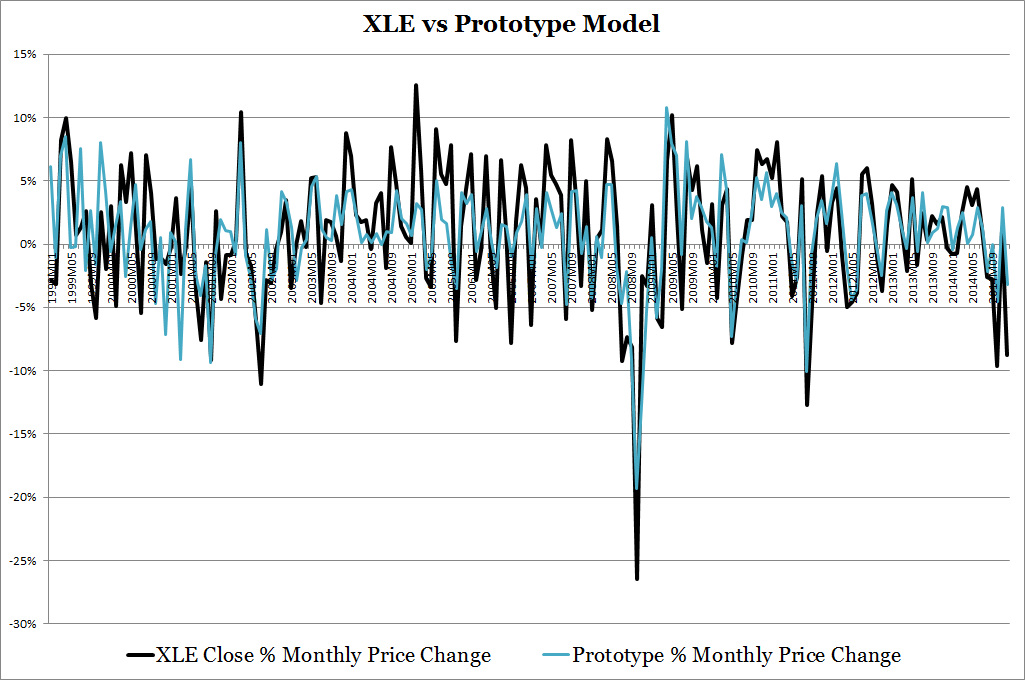
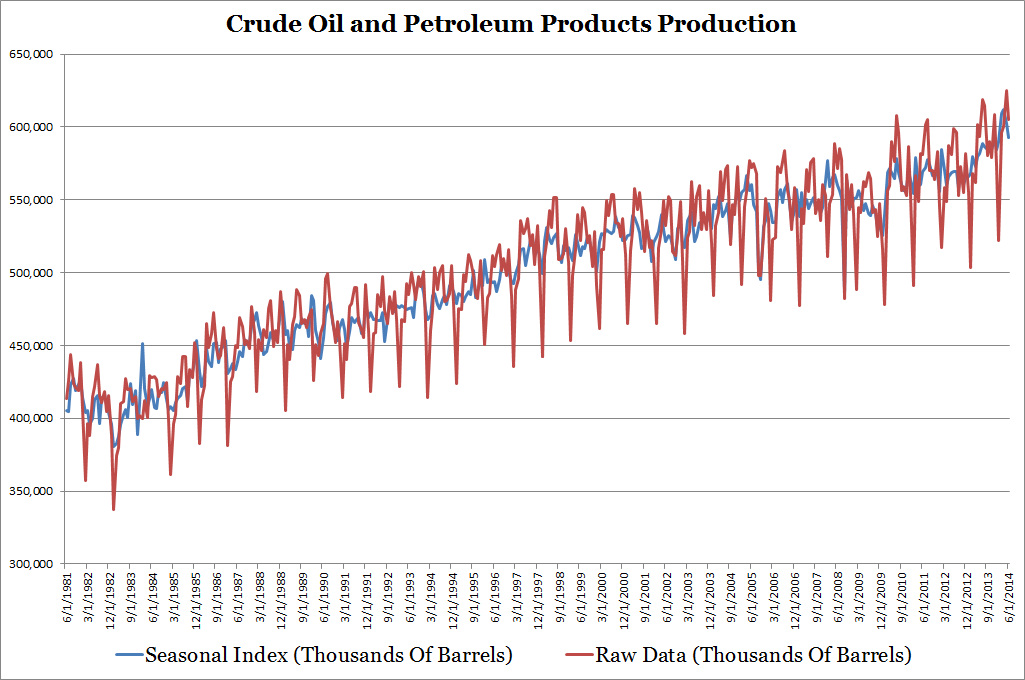
After spending time polishing up my statistical knowledge I created another energy industry prototype model built on what I learned so far. This prototype uses exactly the same data as the Energy Industry Investment Model. The difference is that the Energy Industry Investment Model uses unadjusted data while the prototype uses seasonally adjusted monthly % change in data which eliminates serial correlation and makes the data Covariance Stationary.
Serial Correlation in a situation in which previous period data points are correlated with future periods. For instance if you measure a car's MPH as it accelerates, A car will show a positive relation between time and MPH.
Covariance Stationary loosely means that the data is anchored at a value and its variance doesn't change much. For example, a car traveling on the highway with light traffic would center its speed around 65 MPH even though there are periods where the car will deviate from 65 MPH due to other highway cars shuffling between lanes.
Without getting too deep into statistics, the data needs to be transformed to eliminate Serial Correlation and become Covariance Stationary before being fed into the model. Failure to fix them will reduce model accuracy.
With that in mind it is time to show preliminary results of the new prototype model for the energy industry. Does it knock out the Energy Industry Investment Model?

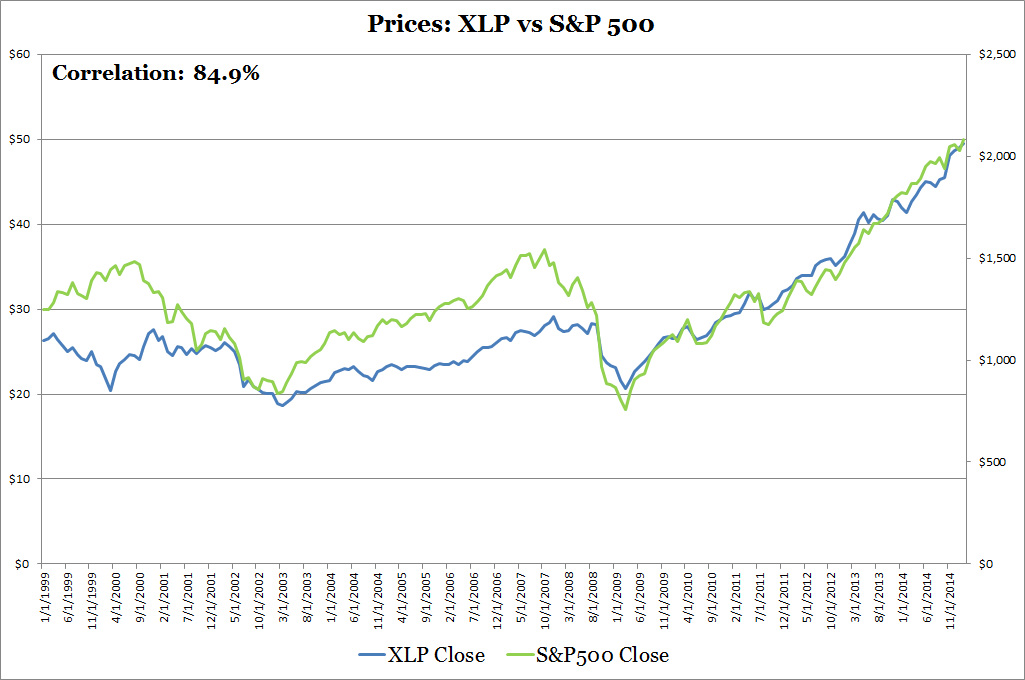
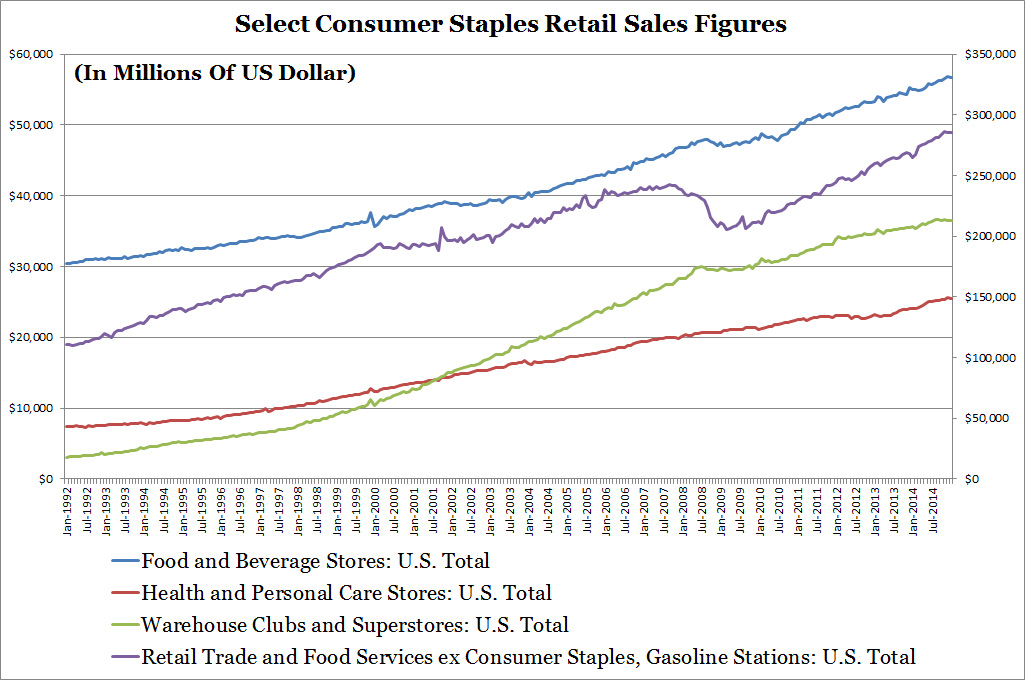
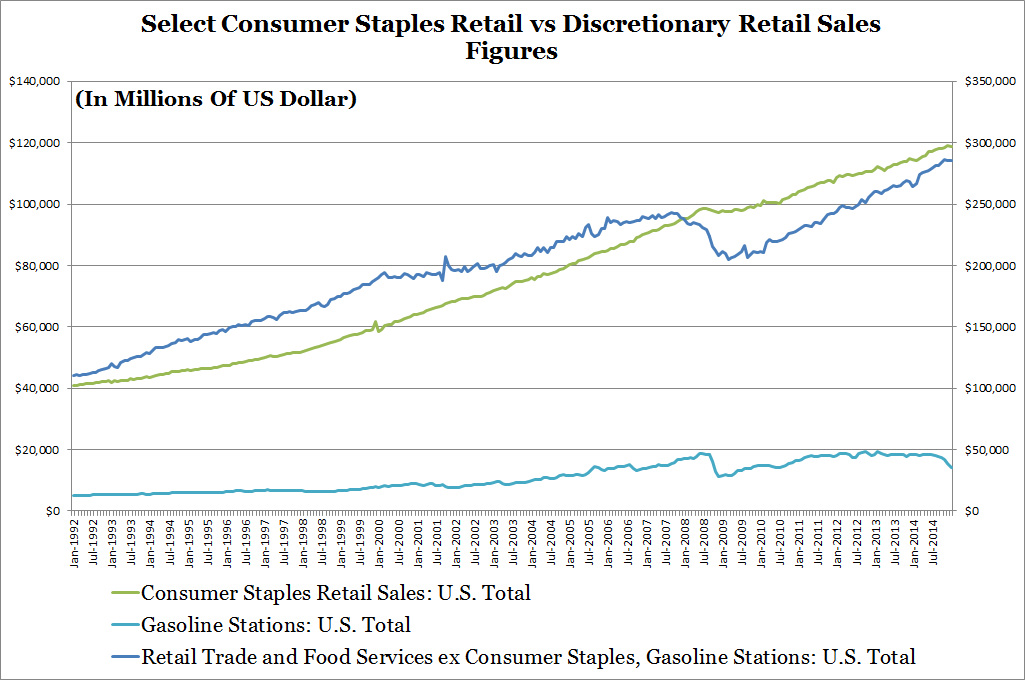
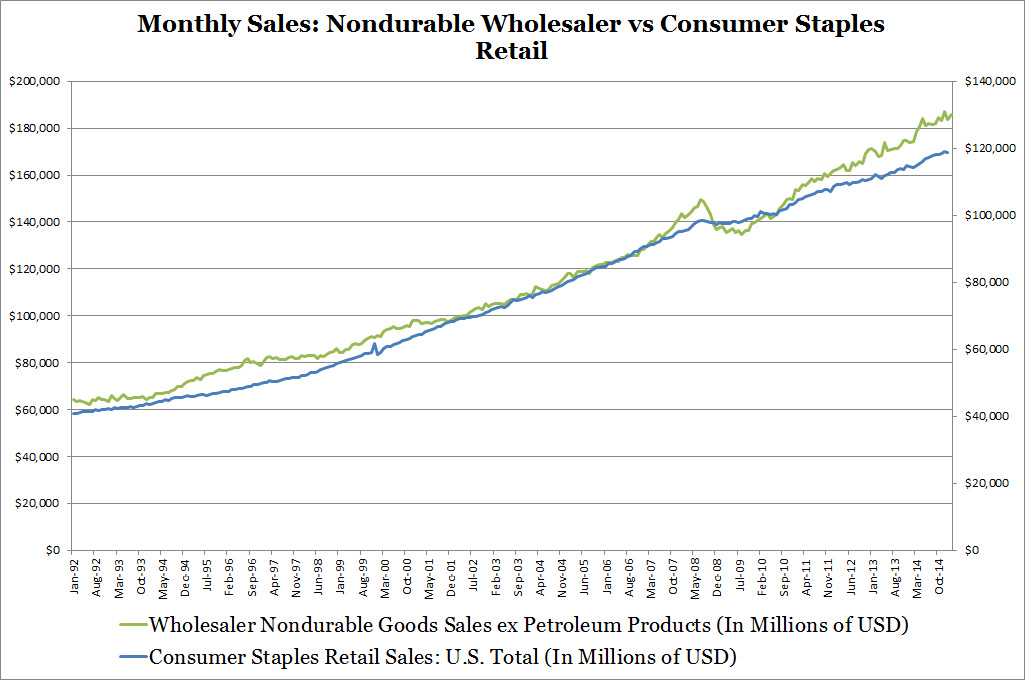
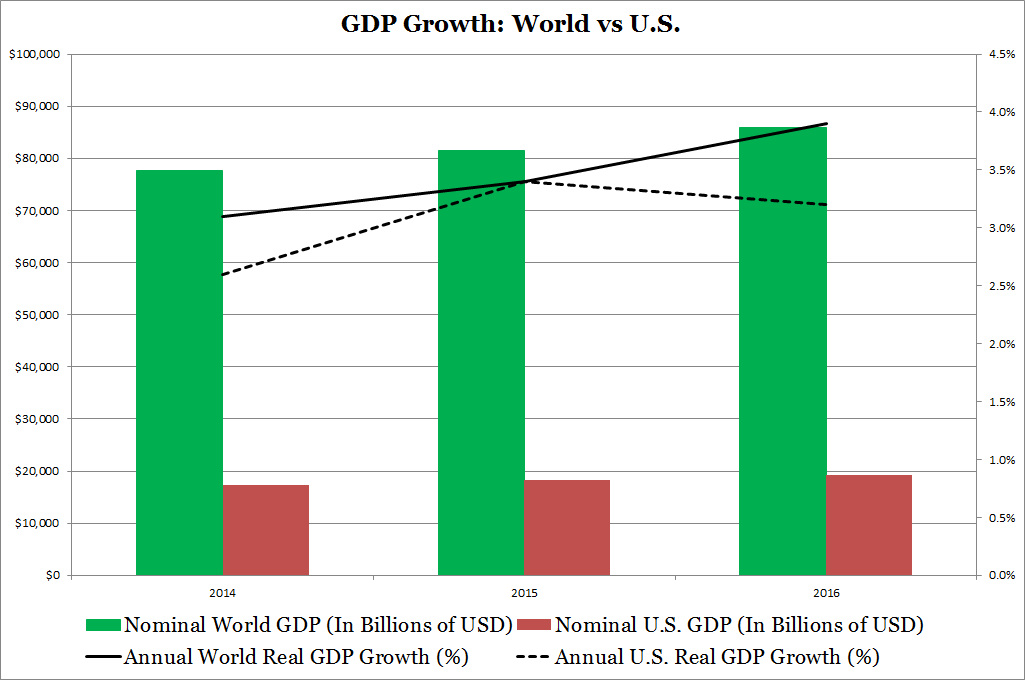
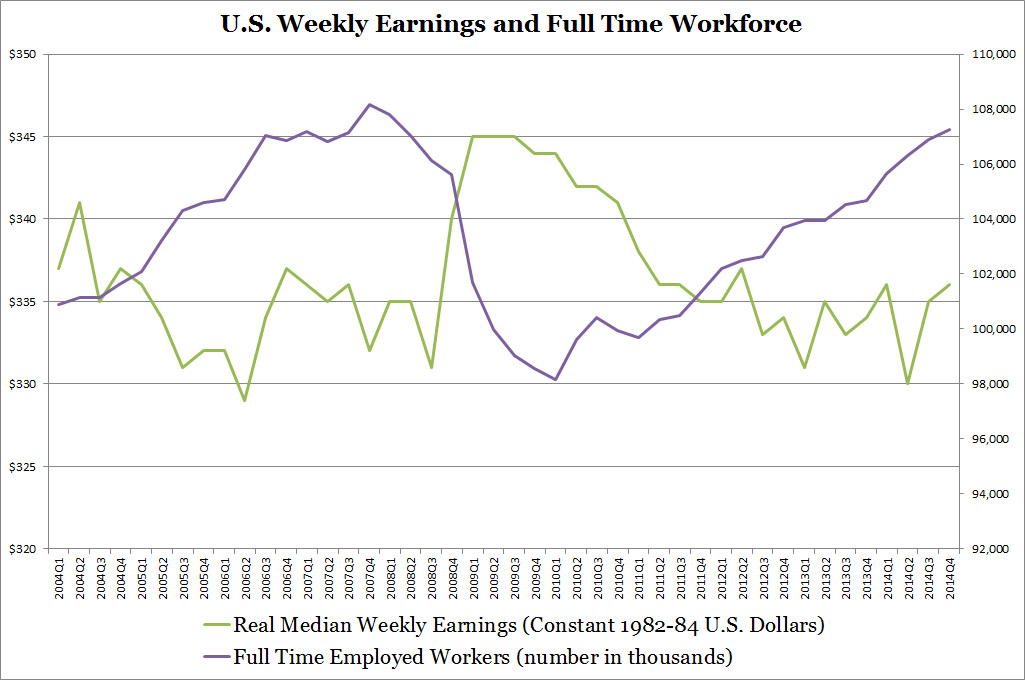
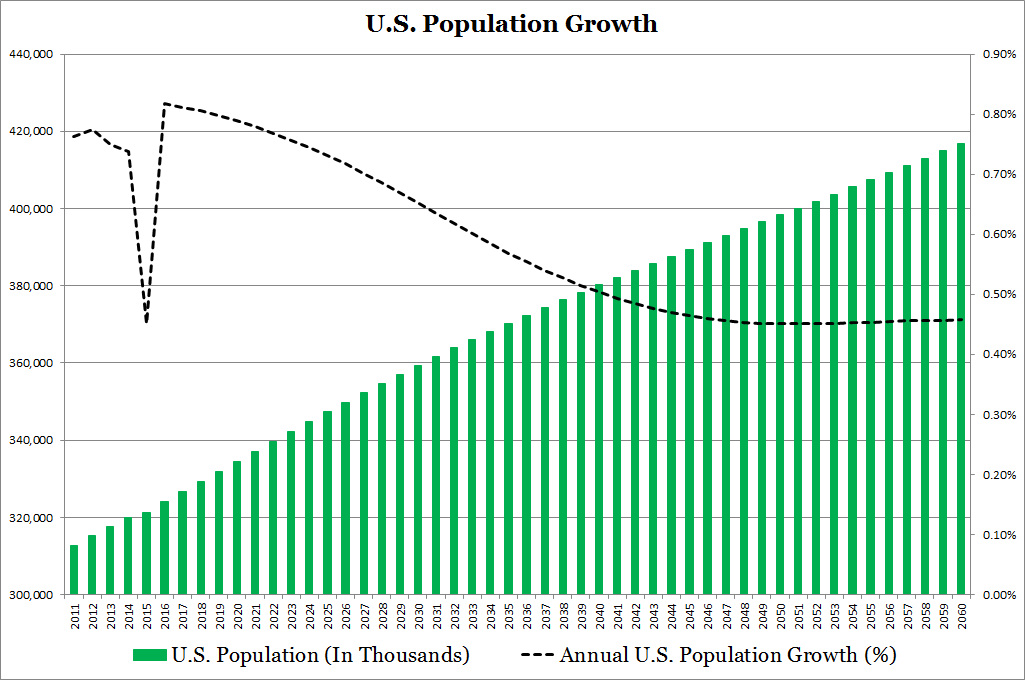
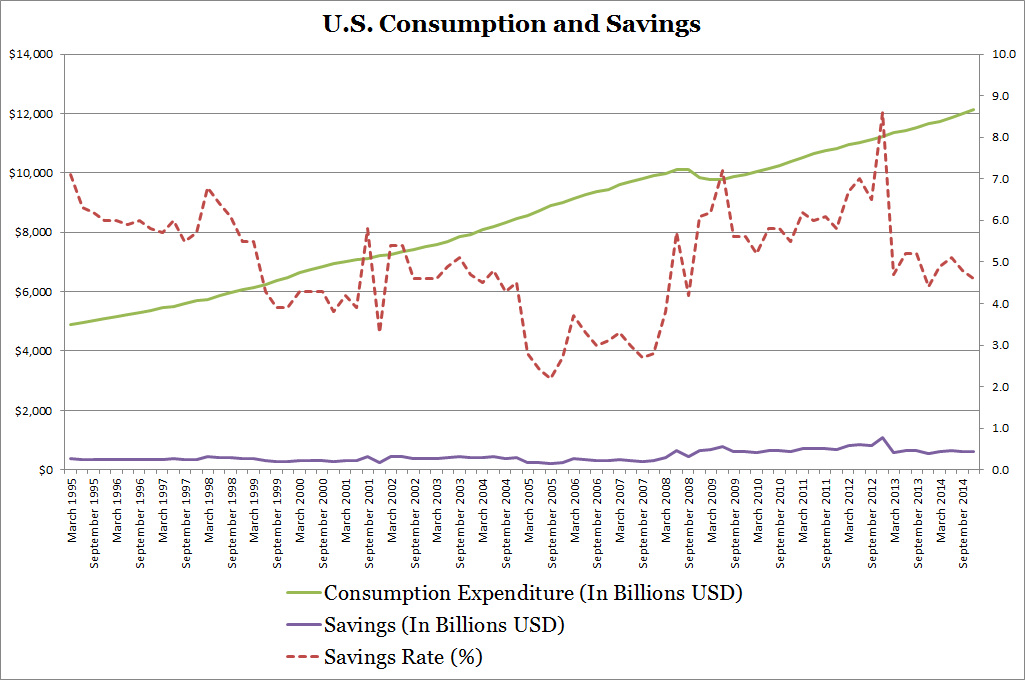
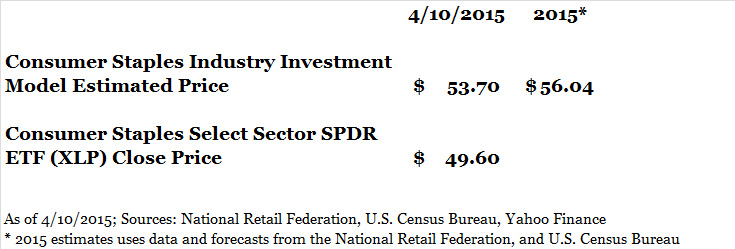
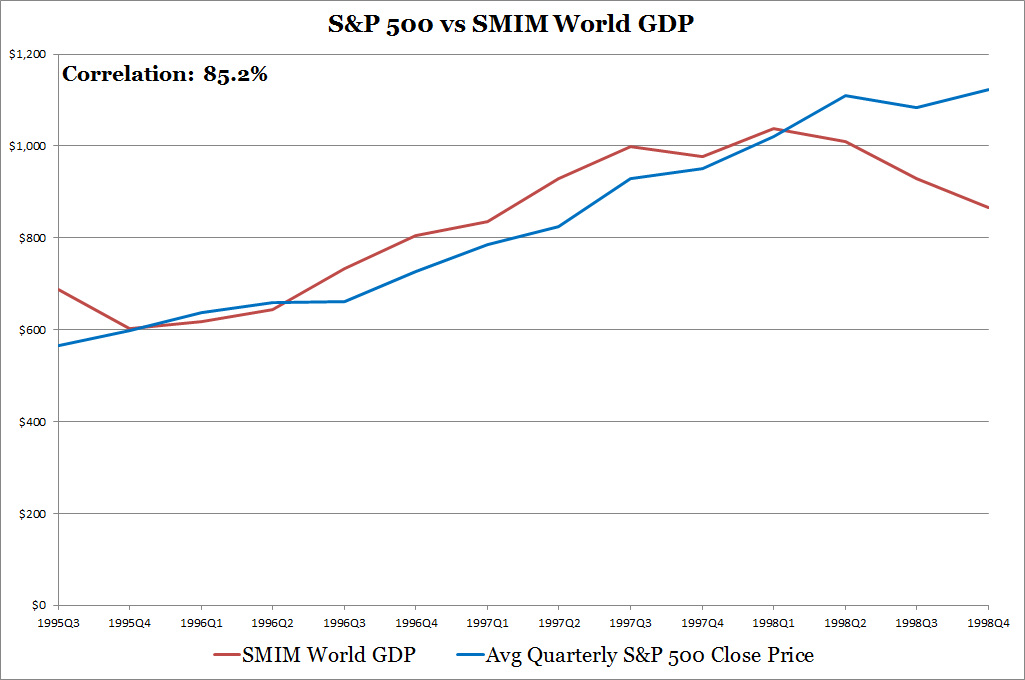
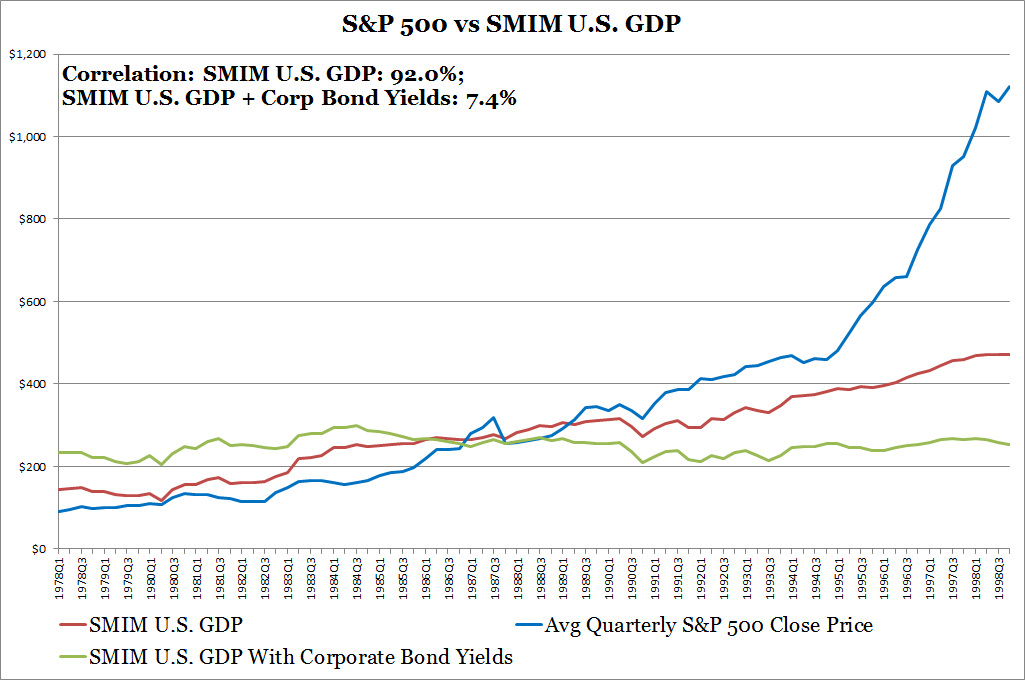
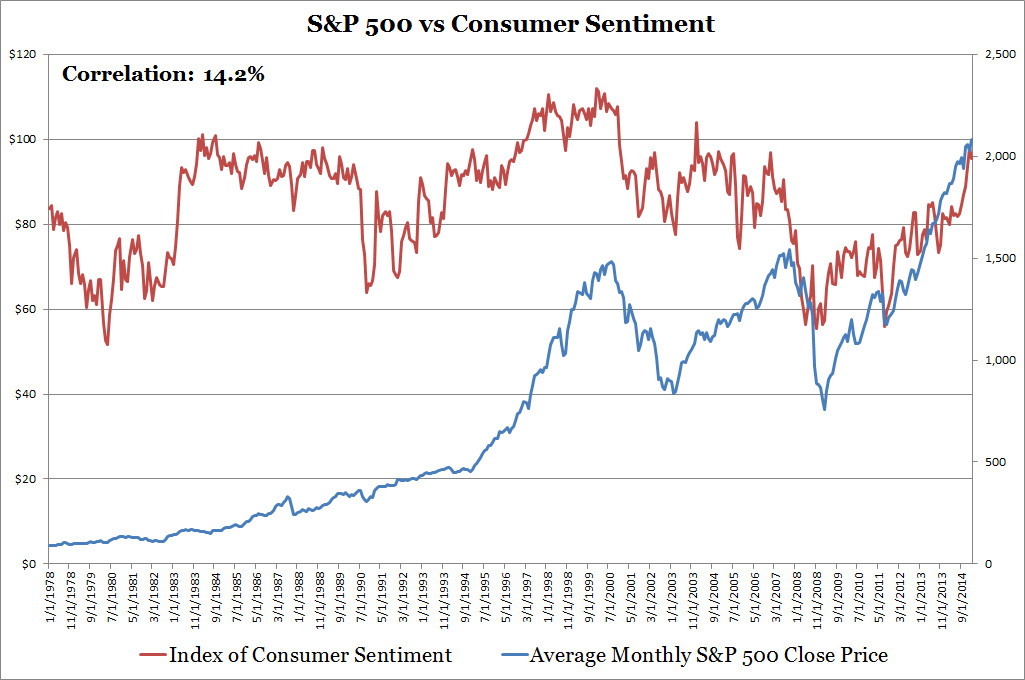
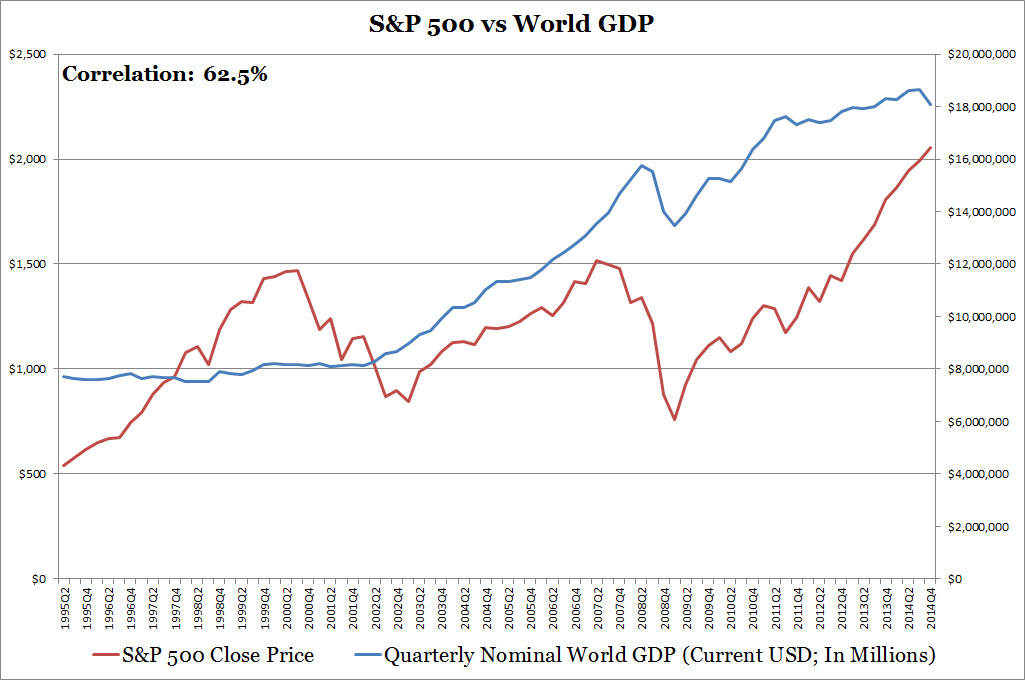
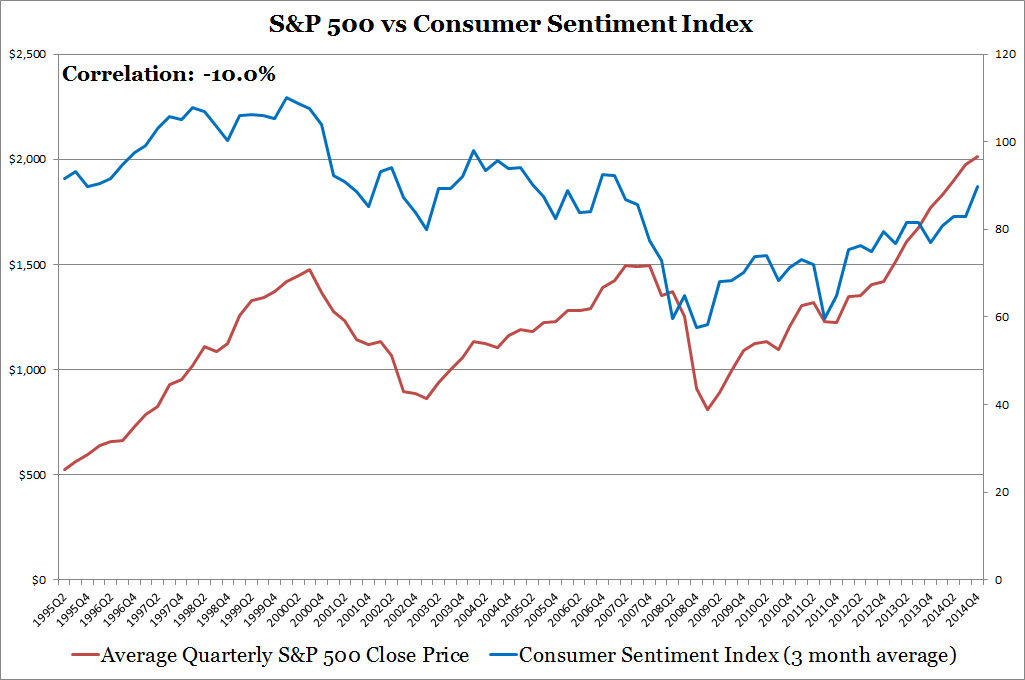
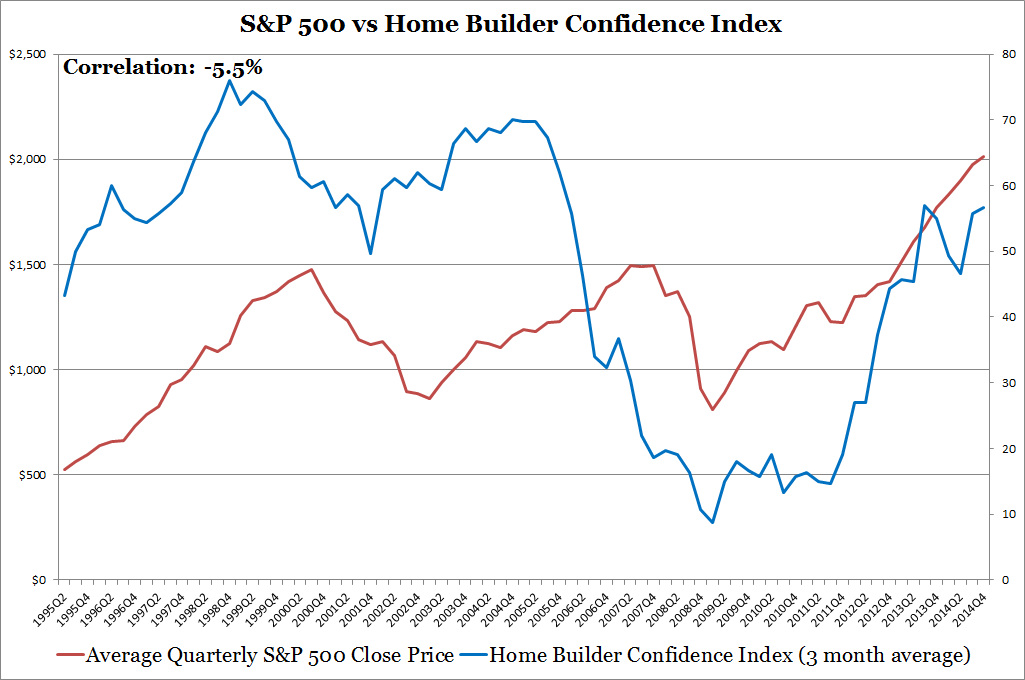
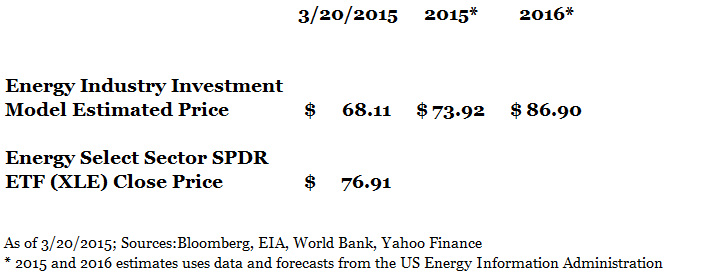
Sources: EIA, World Bank, Yahoo Finance
Sources: EIA, World Bank, Yahoo Finance
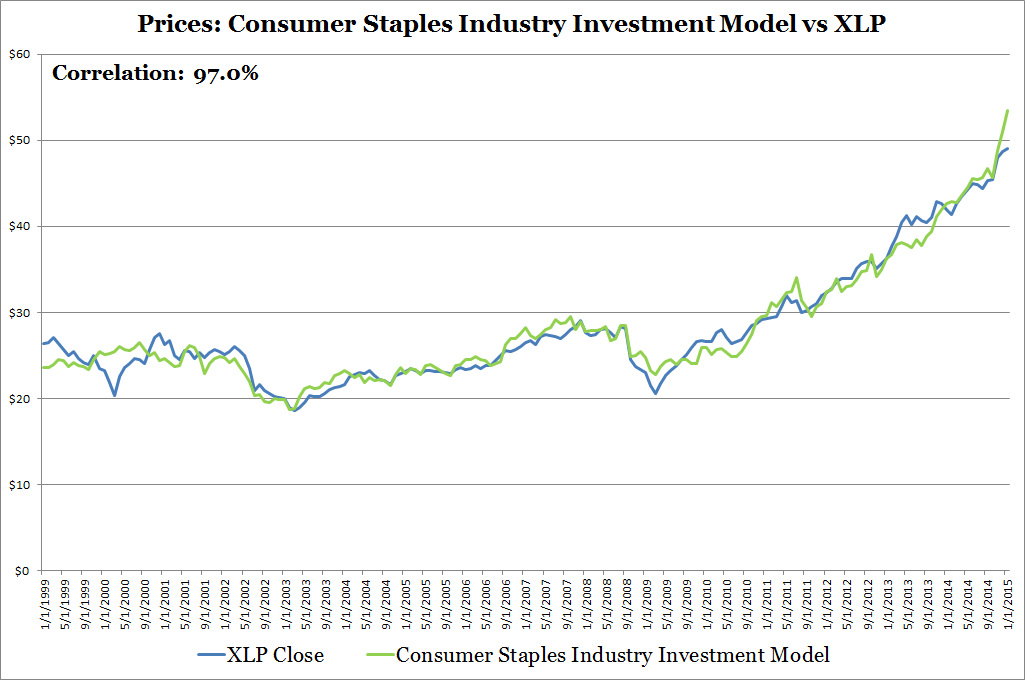
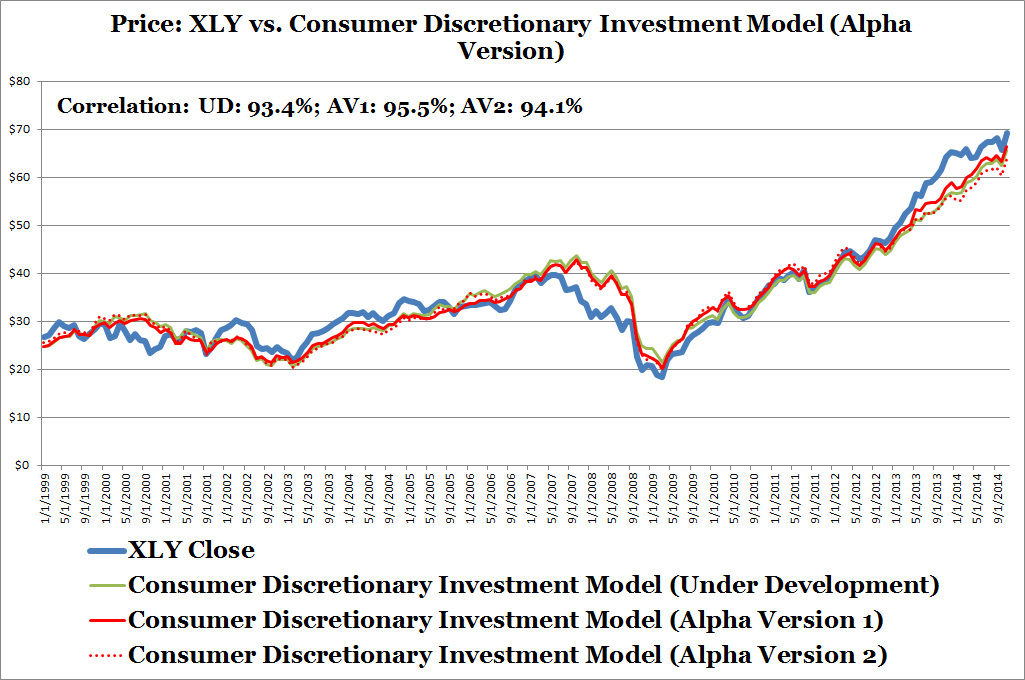
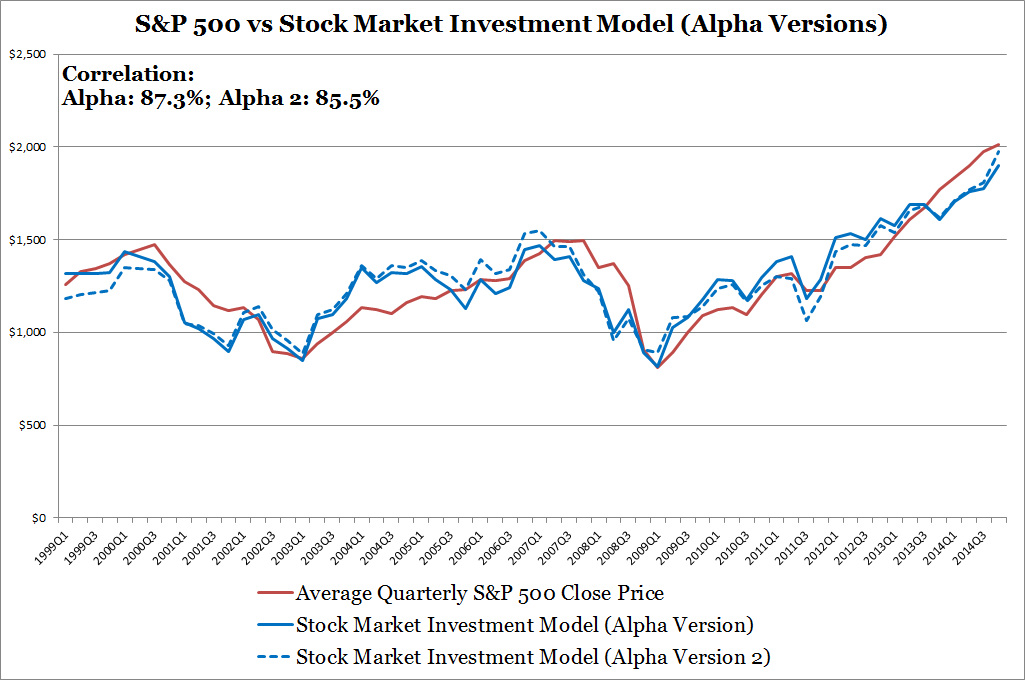
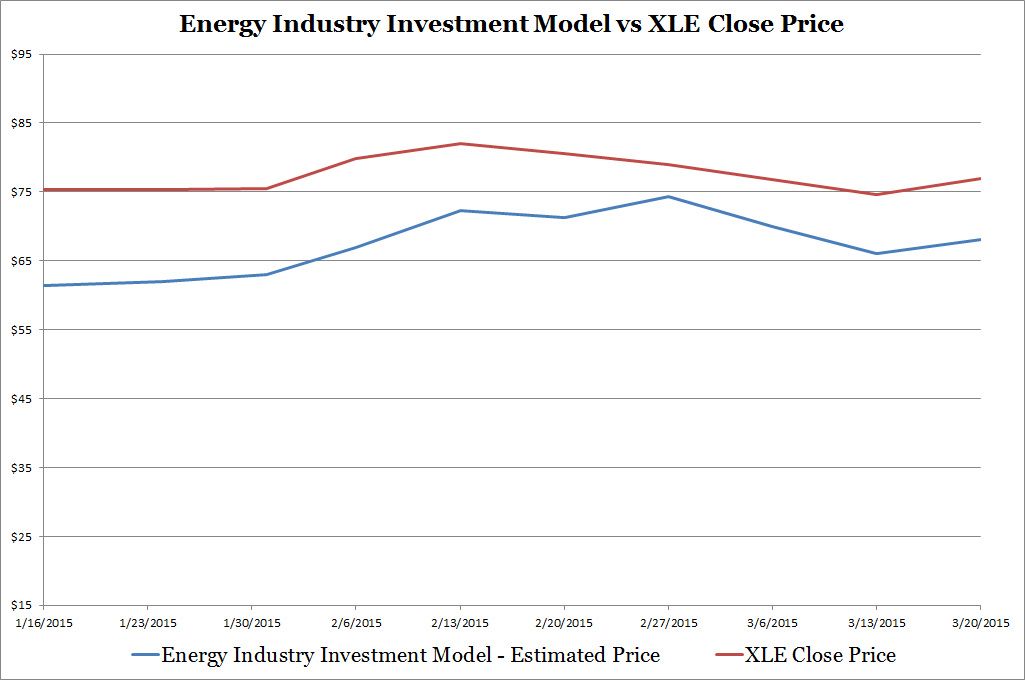
My charts show that the prototype is unable to wrestle the crown away from the Energy Industry Investment Model. The prototype model results seem flat and fails to capture the volatility in XLE prices sufficiently. This puzzles me. Why would the current model built without considering seasonality, serial correlation, and covariance stationary data be more accurate?
I have two theories:
1. The current Energy Industry Investment Model despite being built without advanced statistical practices is so effective that it didn't material affect accuracy.
2. The prototype model is built missing a critical statistical transformation or process that I am not currently aware of.
I will explore this and get back to you.
My outstanding to-do-list still hasn't changed. Running statistical tests and building a better model is still my first priority. The only higher priority is watching the Mayweather/Pacquiao fight Saturday.
My outstanding to-do-list in order of priority:
Thank you for reading. I'm looking for a Pacquiao victory.
I have two theories:
1. The current Energy Industry Investment Model despite being built without advanced statistical practices is so effective that it didn't material affect accuracy.
2. The prototype model is built missing a critical statistical transformation or process that I am not currently aware of.
I will explore this and get back to you.
My outstanding to-do-list still hasn't changed. Running statistical tests and building a better model is still my first priority. The only higher priority is watching the Mayweather/Pacquiao fight Saturday.
My outstanding to-do-list in order of priority:
- Continue to run statistical tests on model built quality
- Finish building the Stock Market Investment Model
- Finish building the Consumer Discretionary Industry Investment Model
- Write an energy industry article
- Investigate why the price estimate of my Energy Industry Investment Model is much lower than the Energy Select Sector SPDR ETF's (XLE) price. I'm looking for evidence to support my hypothesis that dividend investors are propping up energy industry stocks.
- Investigate dot com era, dot com crash, and subsequent recovery effects on both the energy and consumer staples industry investment models.
- Investigate why merchant wholesaler inventory levels affects consumer staples industry stocks. I suspect two reasons: higher merchant wholesaler inventory levels equate to higher profit margins for consumer staples retailers or inventory levels is a result of future sales expectations.
- Write an article about lessons I learned from Mohegan Sun casino.
- Write an article about how to identify stock market tops.
Thank you for reading. I'm looking for a Pacquiao victory.


 RSS Feed